Towards Better Experiment Prioritization: With Less Guesswork And More Honesty
People are terrible at predicting a/b test impact or outcomes. Yet many popular prioritization frameworks (PIE, RICE, ICE) ask us to do just that. Others have hard coded their own guesses into a set of fixed questions that remain subjective (PXL). Since this frustration resonated on LinkedIn the other week, I decided to elaborate on how to potentially improve the way we prioritize our experiments and a/b tests - with a little less guesswork, a little more honesty, and a simple Google Sheet. :)
1. Essence Of Any Improvement: Accountability

Frist, let’s start by admitting one of our biggest assumptions. If we truly wish to improve something with regular practice, surely we’ll also need to keep track of how well we’re doing. This also applies the activity of prioritizing experiment ideas. When I look at prioritization of a/b tests, I essentially view them as predictions. Prioritization in my view ought to predict that some ideas will do better than others. This stems from our desire to do a little better than random chance (obviously keeping in mind that with enough experiments, randomness will also lead to gains making it immensely valuable and often underappreciated).
Frameworks however seem to either have forgotten or missed the opportunity to emphasize the importance of accountability checks. The popular frameworks (PIE, PXL, ICE, RICE) don’t mention anything about keeping track of test results in order to compare: predictions to actual results.
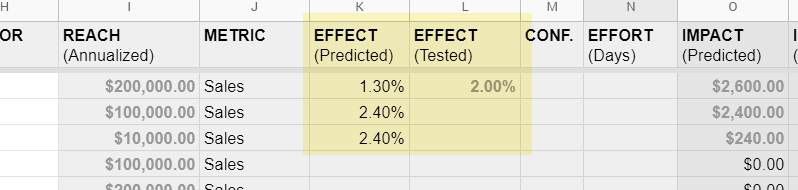
If we are to improve our rate of successful prediction (and hence prioritization), I think doing this simple tracking is important. Here I’d like to introduce a simple Google Sheet we started using to prioritize our experiments. To track past results, all we did was create two columns for what the predicted effect was, and another one for what it actually was.
This is the only way I know of that we can truly assess which framework, or more interestingly, which specific variables from the framework, might lead to predicted results while also learning which are fluff. And if it turns out that the framework doesn’t do any better than chance, it might be a signal to revisit your prioritization as it could be simply a waste of time.
2. More Honesty: Reach x Effects

Now imagine an experiment that generates a 10% effect towards your primary metric, while a second one brings in a 30% gain. At a high level the 30% looks a lot better, as long as you ignore its exposure or reach defined by where the experiment initially started (also known as its testing scope). Here you can think of reach as the number of successes, transactions or revenue that your experiment eventually leads to.
Intercom’s RICE framework (where the R stands for reach) actually encourages to “use real measurements from product metrics instead of pulling numbers from a hat” when defining reach. This is a great deal better than what ConversionXL’s PXL framework suggests with its oversimplified boolean and highly subjective expression for a low (0) or high (1) traffic page. Wider Funnel’s PIE framework also is weak in this regard as it puts the effort on humans to guess importance between 0 and 10.
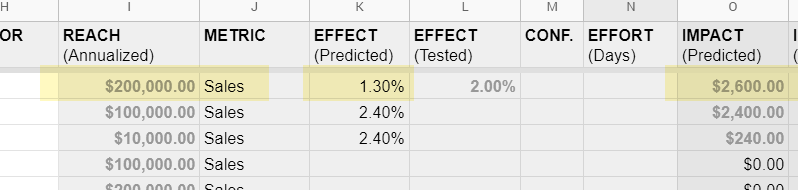
Olivia Simon, Optimization Manager at the Wall Street Journal (now Vimeo) has been prioritizing experiments using reach with such a data-driven and revenue quantified manner. Inspired by this approach, we updated our Google Sheet with three columns: reach x effect = impact. Impact here provides us with a more accurate estimate of how much value we can bring. It allows us to compare and decide which experiments to run first that might begin on different pages with different business values (pulled from analytics of course).
When defining reach, our considerations also include:
- Forward Reach. It’s less about the number of people entering the experiments (visitors or sample size) and more about the quantity of the end outcome (signups, successful transactions, or revenue)
- Dollar Amounts. We try to express reach as a dollar amount where possible.
- Annualizing. To make experiments more comparable between each other, we try to use annualized numbers from GA that compensate for seasonal fluctuations.
3. More Honesty: Using Past Data To Predict Effects

When it comes to expressing the impact a/b tests, popular frameworks such as ICE, RICE and PIE assume that human beings will guess the impact correctly with a subjective expression ranging somewhere between 0 and 3, or 0 and 10.
The question then is whether humans can be trusted to guess outcomes? One simple example of how poorly humans predict quantities can be found in the opening pages of Hans Rosling’s book Factfulness. Rosling regularly quizzed various people with multiple choice questions (ABC) about quantity related topics on: poverty, energy, environment, demographics, education, births, deaths, etc. What he found was that chimps, randomly pointing at the answers due to their inability to read, got 33% answers right. Comparatively, humans on average only managed to get 16.6% of the 12 ABC answers right. That’s two times worse than relying on chance (or chimps) alone.
I’m not sure exactly how these low prediction rates translate from the social sciences to the realm of UI, conversion optimization and online experimentation. And the correct answer rates also vary between countries and across question types. Nevertheless, this is a subtle warning that sometimes we’re not as smart as we think we are.

The PXL framework by ConversionXL, although well-intentioned, has taken some of this subjective guesswork away from us only to replace it with their own subjective true and false criteria. For example, one PXL criteria assigns higher points if the change is visible in the first 5 seconds. Another PXL criteria assigns additional points to those ideas that arose due to a mouse tracking study. The way I see this is that higher points imply better ideas that ought to be tested above ideas with lower scores. But how do we really know that such scores correlate with higher success rates or higher impact rates? This boolean selection might be easier for users to express, however at the core this is still very much based on subjective hypotheses - which in my view, may or may not be correct and therefore demand further evaluation.
Shifting away from guesswork, some companies are starting to seek out and hypothesize that more accurate predictions may be obtained using data from past experiments.
Olivia Simons from WSJ for example has began referencing past experiments to predict future ones:
We reference previous tests and onsite data, to make an educated guess. The data we have helps us to make an informed projection of what might happen .
Frank Hopkins from BBC experimentation team, has also shared how they look for headline patterns across past experiments using meta-analysis to derive what works better and by how much.
Meta-analysis is a powerful tool for assessing the combined effect of multiple individual experiments and can help teams across the BBC understand generalised learnings from experiments. This is essential in editorial testing, where it is often hard to derive long-term findings from individual tests. Whether we are determining the optimal length of words to use in headlines or which characters our audiences respond to best, Meta-analysis helps us draw finite conclusions about our experimental themes.
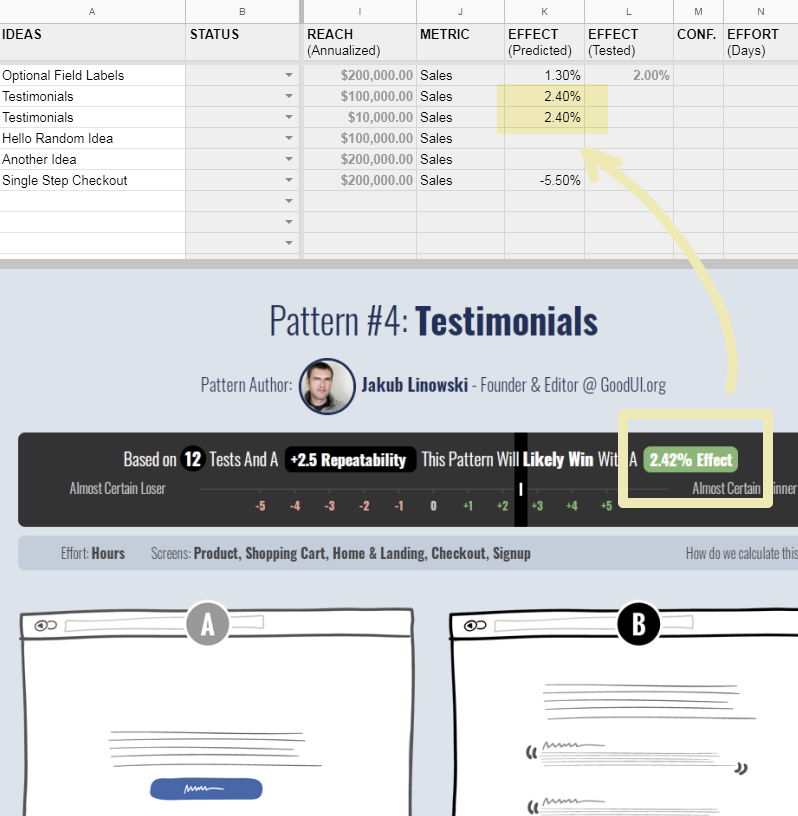
On our own projects, we have also started relying on combined data from multiple experiments (captured as patterns) to guide future predictions. Hence a typical testimonial injection might come with a general +2.4% effect prediction derived from a Testimonial Pattern based on 12 experiments run by independent companies. Prioritization in this scenario becomes a simple act of copying past data to make future predictions.
On top of making data-based predictions, we also encourage to build in feedback loops (and do this ourselves under the GoodUI project). That is, once an experiment finishes, it is then added to a set of similar experiments independent of whether it succeeds or fails. This way, predictive accuracy should increase over time.
4: More Honesty: Negative-Positive Predictions

Because PIE, PXL, ICE and RICE all rank our ideas higher than 0, there are no bad ideas. These frameworks suffer from a lack of directionality. Losing or negative a/b test predictions are impossible.
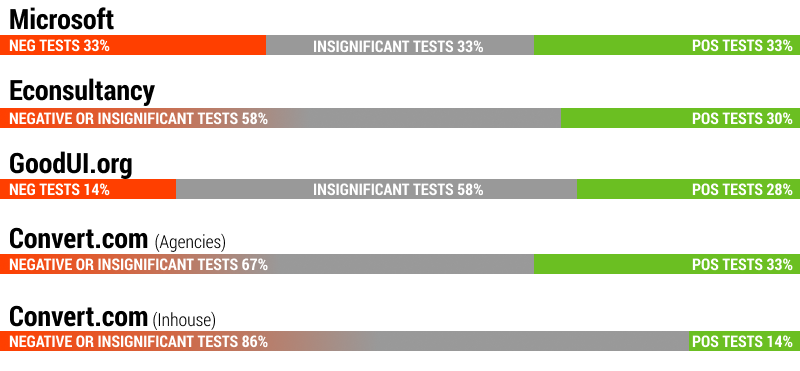
Of course we know that this is a distortion and mismatch from reality. A simple lookup from our own repository of 234 experiments on GoodUI gives us a proportional snapshot of losing (14%), flat (58%) and winning (28%) experiments. Our findings are comparable to Microsoft’s general experiment win-loss rates with approximately: ⅓ negative, ⅓ insignificant, and ⅓ positive outcomes. Similar distributions have been found by a Econsultancy Report and Convert’s Findings when they analyzed their own sets of past experiments. The reality of experimentation leads to losing experiments - but prioritization often misses this critical element.
If we are to respect reality, prioritization then needs to enable negative predictions for those ideas that have lost in past experiments. For example, if someone were to test a shift from a multiple step checkout towards a single step one, based on the data we have today, we might assign a negative -5.5% prediction. This does not mean that we cannot run the experiment, but at least we’re more honest by introducing negative probability. Here is how such a potentially negative idea might look like:
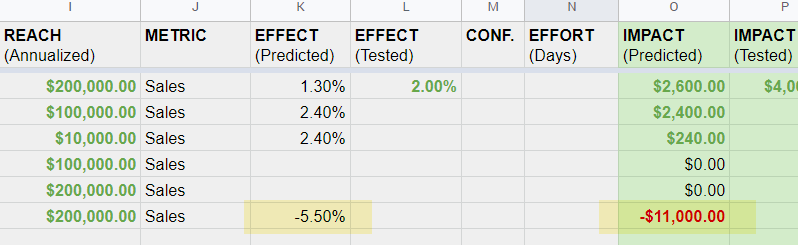
Without negative predictions we are essentially forced into an endless positive-feedback loop of having to test all experiments (because they all imply positive potential). Without negative predictions, our prioritization model is overconfident and disconnected from the reality that there are many test ideas that will lose.
5: More Flexibility: Separation Of Effort
Most frameworks try to make it easier for us to decide on what to focus on next by collapsing multiple variables into a single comparable value. Sometimes this includes combining effort with the potential effect or impact of the experiment idea. RICE for example encourages the following calculation: benefit ÷ effort. PXL on the other hand assigns more points for lower effort test ideas (to be added to other impact predictors). PIE averages effort scores (lower effort = higher points) with impact and confidence scores.
What I found however during projects is that keeping an effort estimation separate as a standalone variable is actually beneficial. The reason for this is to empower the person who is planning experiments to fit them in accordingly depending on what time and money resources are available. Sometimes it’s optimal to start an easy test, whereas at other times, the team has more time to run a demanding experiment. And hence, we often encourage to express effort in a separate column as a duration, like this:
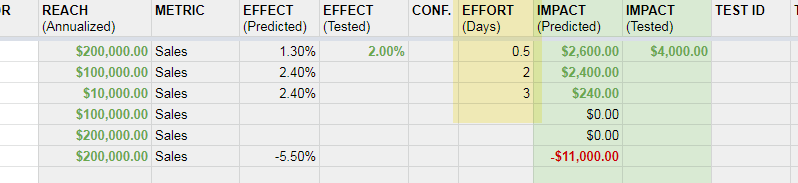
Aside from the above, probably the best secondary example of how to merge cost and benefit is how Olivia from WSJ has outlined in her process. Effort is expressed as a calculated dollar amount and then subtracted from an impact dollar. In this scenario of course both values are representative of the same thing: money. One little problem that such a comparison forgets is that the benefit of positive test might be recurring and long term, while the cost of a test most likely is fixed or one-time.
Can We Improve Experiment Prioritization Even Further?
Of course we can (and should). I hope this critical list of suggestions isn’t perceived as the ultimate end, there is still so much more to improve and here are some further directions:
- Multiple Predictors - I think it would be eye opening to keep evaluating a wide range of factors that may or may not play a role in leading to positive outcomes. PXL started on a good direction by making these variables explicit: (user research, analytics, etc). There might be other interesting variables that could be evaluated as well, including:: crowd intelligence, degree of reproducibility, and of course past experiment data.
- Confidence Intervals - When making predictions and keeping track of results, it might be more accurate to represent effects with a margin of error or confidence intervals.
- Testing Sensitivity - Given that low effects on low traffic pages (defined by its test scope) might take a really long time, a prioritization framework could do a better job at dynamically flagging such experiments. This way, experiments which are bound to be insignificant could be minimized.
- Implementation Triggers - As evidence in favor of a pattern grows or weakens, some patterns could arguably attain such high probabilities that the benefit to implement overshadows its need for testing. It would be great if those test ideas were marked as such.
- Trade-Offs - currently this framework only allows predictions for a single primary metric. The reality however is that some patterns come with trade-offs. That is, they might increase one metric, but hurt another. It would be more accurate to make and track such type of predictions.
- Combined Changes - One last danger from keeping all your testing ideas as separate ones, is that you make yourself believe that you have to test them in isolation. This is not true as we’re starting to see that larger experiments may lead to a larger impact (if designed appropriately). Although we started marking such leap experiment, there is probably more opportunity in predicting what effects such multiple experiments may lead to.
So Have We Finally Eliminated All Subjectivity?
Of course not. If we choose to rely on past test results to predict the outcomes of future ones, some subjectivity will still be found in how those experiments were selected into patterns in the first place. If patterns hold similar experiments together, it’s important to remember that no two experiments are alike. Defining these predictive patterns is still a human and subjective process (today at least).
Subjectivity may also be present when we use patterns to design our experiments. Although we might know that removing a blank coupon code will likely lead to more sales, making this prediction also requires some pattern matching. Even if we choose to copy an existing pattern, the way in which we interpret it will likely introduce subtle and unique differences brought on by own subjective interpretation. Subjectivity perhaps allows us to connect the past with the future in an interesting and varied way.
Subjectivity at this point might not be such a bad thing. The best we can do is be more honest about where it has shifted and pinpoint which form it takes. And by pursuing prioritization ever more honestly, with time, I truly hope that this will improve our ability to predict outcomes with a higher accuracy. This of course we’ll only find out if we track our experiment results and compare them to our initial predictions.
Posted by  Jakub Linowski on Dec 09, 2019
Comments
Shaun 4 years ago ↑0↓0
Having difficulty putting a $ to reach and predicted impact :(
Reply