What To A/B Test Next
A successful optimization process largely depends on letting the best testing ideas trickle to the top. This is especially true as companies become serious about data-driven design and testing ideas begin to queue up. On our own client projects we’ve also experienced this “piling up of ideas” and now we usually prioritize tests by: highest expected effect, highest confidence, lowest effort, and shortest testing duration.
Highest Expected Effect + Highest Confidence
One of the key characteristics that we look at when surfacing a testing idea is its potential for generating a desired lift. In these terms, a test idea that we feel might generate a +15% improvement will receive greater priority over a test that we think only has a +5% expected effect. As we estimate and makes such guesses before starting a test, we also try to represent our confidence at the same time. This is somewhat optional and usually done with a confidence interval representation. Hence an effect may be estimated at +15% with a ±10 range, rendering it anywhere between +5% and +25%. Factoring such confidence into prioritization, a test with a tighter range could be tested before a test idea with a wider confidence range.
Another important point to be made here (which we hope to elaborate in another post) is the opposite situation when there is very high confidence in an expected effect. Let’s say we have ran a similar test five times across numerous sites and they all bring in a clear stable improvement backed up by solid theory. Based on these repeating effects we might make an effect prediction of +25% with a narrow ±5 range. In such situations, testing this idea might come into question as implementation can be considered instead. Essentially, the more we know and the higher our confidence in an idea, the less value we’ll receive from testing - keep that in mind.
Lowest Effort
Another important criteria for prioritizing A/B testing ideas is based on the effort necessary for rolling out an experiment. Ideally, you wish to surface test ideas which require the least amount of energy, first. Sometimes we apply such a lowest effort first strategy as we begin a lengthier testing program. This minimizes testing downtime, gets an initial low cost / low risk test started, and we may then spend more thought on additional tests as the first one runs.
Shortest Testing Duration
Testing duration is another important factor in choosing what to test next, as time is precious. Assuming we are comparing two equally powered tests that both can detect the same effect, the test has a shorter duration estimate, should ideally go first. Usually, a higher effect automatically corresponds to a shorter testing duration. However, other factors such as a higher baseline conversion and higher sample size will also decrease your required testing time even further.
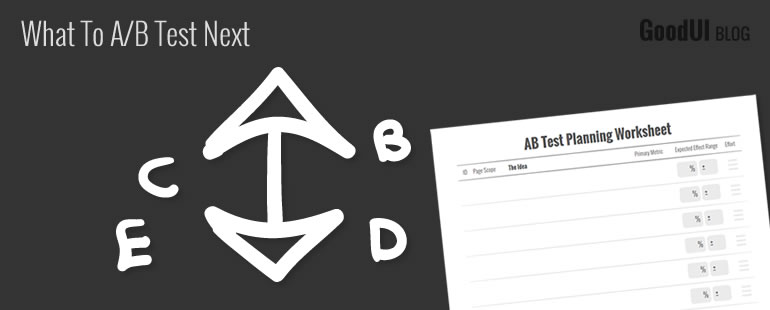
Prioritization Worksheet
To help you think through these criteria on your own a/b tests, we designed a prioritization worksheet. Hopefully, it will come useful in expressing testing ideas from the perspective of: expected effect, confidence, effort, and testing duration.
Making such predictions of effects, efforts and duration before a test of course are just educated guesses. Naturally, when starting out to optimize for the first time, predicting the results will not be easy which is completely understandable. When not having any idea whatsoever of what the effect will be it should be acceptable to represent tests with an expected effect of 0% and a ±15 range, for example. The important point however is to become aware of (and true towards) your own understanding and confidence levels. As more a/b tests are ran, making these estimates should become easier.
Developing sensitivity towards these test criteria is valuable in helping you decide what to A/B test next. Pushing the best test ideas to the forefront will save you testing time, result in more winning tests, and is an important part of a healthy optimization process.
See How We Prioritize & Run Actual A/B Tests
In Datastories, we explore various testing strategies on real projects and share them with you.
A successful optimization process largely depends on letting the best testing ideas trickle to the top. This is especially true as companies become serious about data-driven design and testing ideas begin to queue up. On our own client projects we’ve also experienced this “piling up of ideas” and now we usually prioritize tests by: highest expected effect, highest confidence, lowest effort, and shortest testing duration.
Highest Expected Effect + Highest Confidence
One of the key characteristics that we look at when surfacing a testing idea is its potential for generating a desired lift. In these terms, a test idea that we feel might generate a +15% improvement will receive greater priority over a test that we think only has a +5% expected effect. As we estimate and makes such guesses before starting a test, we also try to represent our confidence at the same time. This is somewhat optional and usually done with a confidence interval representation. Hence an effect may be estimated at +15% with a ±10 range, rendering it anywhere between +5% and +25%. Factoring such confidence into prioritization, a test with a tighter range could be tested before a test idea with a wider confidence range.
Another important point to be made here (which we hope to elaborate in another post) is the opposite situation when there is very high confidence in an expected effect. Let’s say we have ran a similar test five times across numerous sites and they all bring in a clear stable improvement backed up by solid theory. Based on these repeating effects we might make an effect prediction of +25% with a narrow ±5 range. In such situations, testing this idea might come into question as implementation can be considered instead. Essentially, the more we know and the higher our confidence in an idea, the less value we’ll receive from testing - keep that in mind.
Lowest Effort
Another important criteria for prioritizing A/B testing ideas is based on the effort necessary for rolling out an experiment. Ideally, you wish to surface test ideas which require the least amount of energy, first. Sometimes we apply such a lowest effort first strategy as we begin a lengthier testing program. This minimizes testing downtime, gets an initial low cost / low risk test started, and we may then spend more thought on additional tests as the first one runs.
Shortest Testing Duration
Testing duration is another important factor in choosing what to test next, as time is precious. Assuming we are comparing two equally powered tests that both can detect the same effect, the test has a shorter duration estimate, should ideally go first. Usually, a higher effect automatically corresponds to a shorter testing duration. However, other factors such as a higher baseline conversion and higher sample size will also decrease your required testing time even further.
Prioritization Worksheet
To help you think through these criteria on your own a/b tests, we designed a prioritization worksheet. Hopefully, it will come useful in expressing testing ideas from the perspective of: expected effect, confidence, effort, and testing duration.
Making such predictions of effects, efforts and duration before a test of course are just educated guesses. Naturally, when starting out to optimize for the first time, predicting the results will not be easy which is completely understandable. When not having any idea whatsoever of what the effect will be it should be acceptable to represent tests with an expected effect of 0% and a ±15 range, for example. The important point however is to become aware of (and true towards) your own understanding and confidence levels. As more a/b tests are ran, making these estimates should become easier.
Developing sensitivity towards these test criteria is valuable in helping you decide what to A/B test next. Pushing the best test ideas to the forefront will save you testing time, result in more winning tests, and is an important part of a healthy optimization process.
See How We Prioritize & Run Actual A/B Tests
In Datastories, we explore various testing strategies on real projects and share them with you.
Posted by  Jakub Linowski on Jul 22, 2015
Comments
Marek Cais 11 years ago ↑0↓0
You say you measure the highest effect as a percentage of improvement, but you don't say over what. Absolute number, or a CR? It is important to remember that getting a 10% gain on a page with 2% CR is different to getting a 5% gain on a page with 50% CR. Sometimes focusing on the highest converting pages may pay off :)
Reply
Jakub Linowski 11 years ago ↑0↓0
You are right. In your first case scenario there would be a 0.2% absolute increase (requiring around 70k visitors per variation). In your second example, there would be a 2.5% absolute increase (requiring only 5.5k visitors per variation to detect). Agreeing that it would be better to run the second test, first. Thanks for the correction. I'll update the worksheet in a few days.
Reply
Smilyan Pavlov 11 years ago ↑0↓0
This is great. Can you add a subscription form so that we can receive an email newsletter? Thank you!
Reply
Michael Kjeldsen 11 years ago ↑0↓0
+1
A TEMPORARY TIP
As a temporary solution I've already set up an automated email-reminder via Mailchimp, that auto-sends whenever Jakub updates the blog/rss feed.
It's quite easy to do (and free):
http://kb.mailchimp.com/campaigns/rss-in-campaigns/create-an-rss-driven-campaign
Reply
Jakub Linowski 11 years ago ↑0↓0
Note taken. Email newsletter signup form most likely will appear here in the future as well. I'll also share articles with those that signup directly from goodui.org.
Reply