Do Adds-To-Cart Or Progression Metrics Correlate With Sales In A/B Tests?
I've been curious about the correlation of secondary metrics such as adds-to-cart with deeper ones like sales (orders, transactions, purchases, etc.) for a while now. Could these be useful to us in some way when we run online experiments? During the summer of 2023, Michael St Laurent of Conversion released an analysis of ~200 A/B tests where he detected some correlation between adds-to-cart and orders. I spoke with Michael and promised I would do the same with our own GoodUI data. And so here is the delivery on that promise with an additional 119 A/B tests and a comparison of both data sets.
Initial Analysis: Adds-to-Cart VS Sales (Orders)
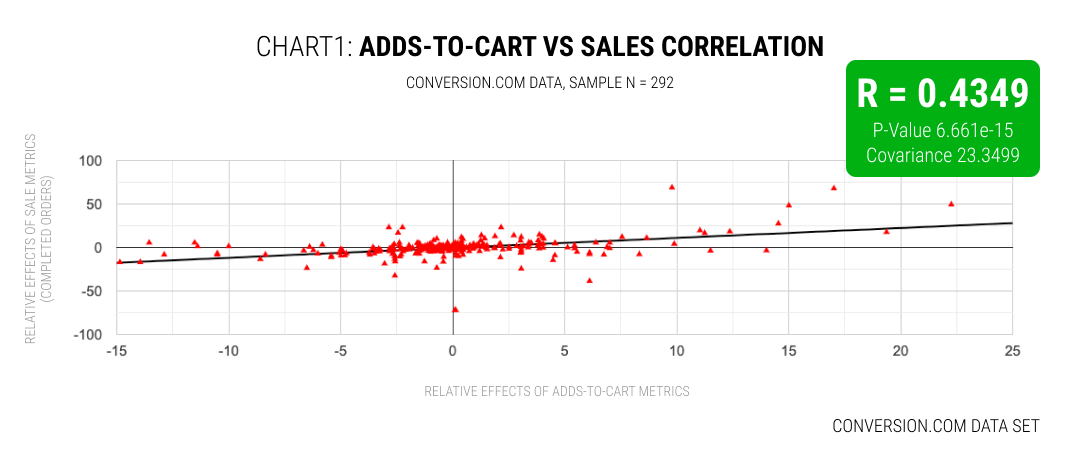
In the initial LinkedIn post by Michael St. Laurent about the correlation of ~200 A/B tests using data from Conversion's Liftmap, he reported that experiments agnostic of significance resulted in a correlation of 35%. While experiments filtered to ones with significance on orders, increased the correlation upwards to 66%.
After following up with Michael, he also agreed to re-run the analysis using the Correlation Coefficient Calculator (from Statistics Kingdom) for additional consistency and detail between both data sets. From this we can see a medium correlation (R = 0.4349) that's statistically significant.
GoodUI Set: Adds-to-Cart VS Sales (Orders)
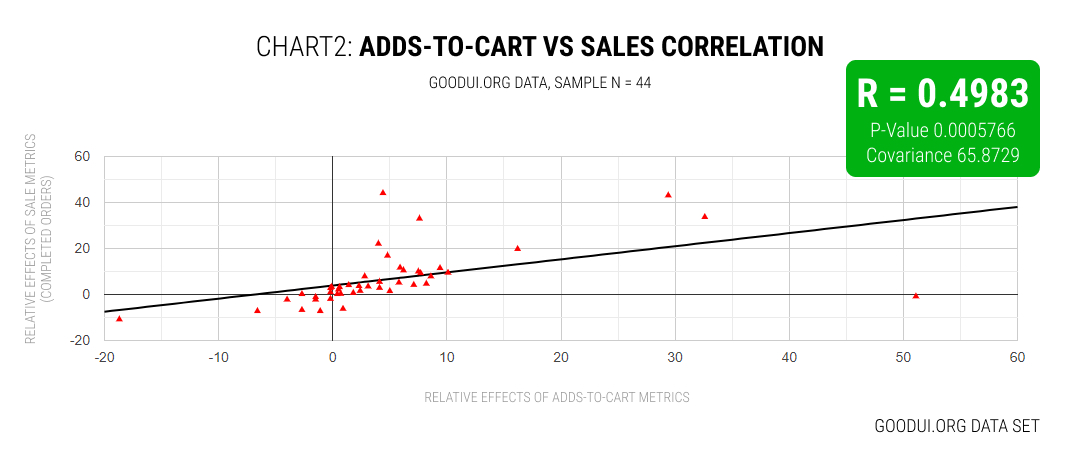
In our own analysis I queried the GoodUI database for A/B tests that contained both: adds-to-cart and sales metrics (orders, transactions, etc.). This resulted in a sample of 44 experiments which were then entered into the Correlation Coefficient Calculator (from Statistics Kingdom). The result came out to be equally similar to the Conversion.com data set with a medium correlation of R = 0.4983 and statistical significance.
GoodUI Set: Any Progression Metrics VS Sales
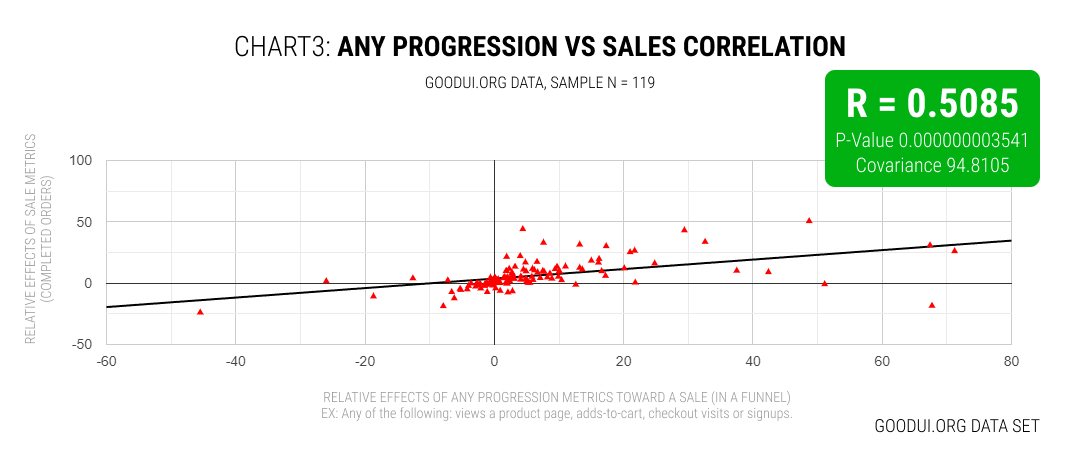
Given that the 44 experiments wasn't a big sample, I also tried to broaden the search. In this next set I queried experiments with any progression metrics such as: a step forward in a purchase funnel towards the direction of a sale, adds-to-cart, checkout visits, shopping cart visits, including 4 signup/lead form experiments that also lead to sales. With this broader query we were able to analyze 119 A/B tests in total. The result of this analysis continued in the direction of a similar trend with a medium correlation of R = 0.5085 and even higher statistical significance.
What About Checkouts VS Sales (Orders)
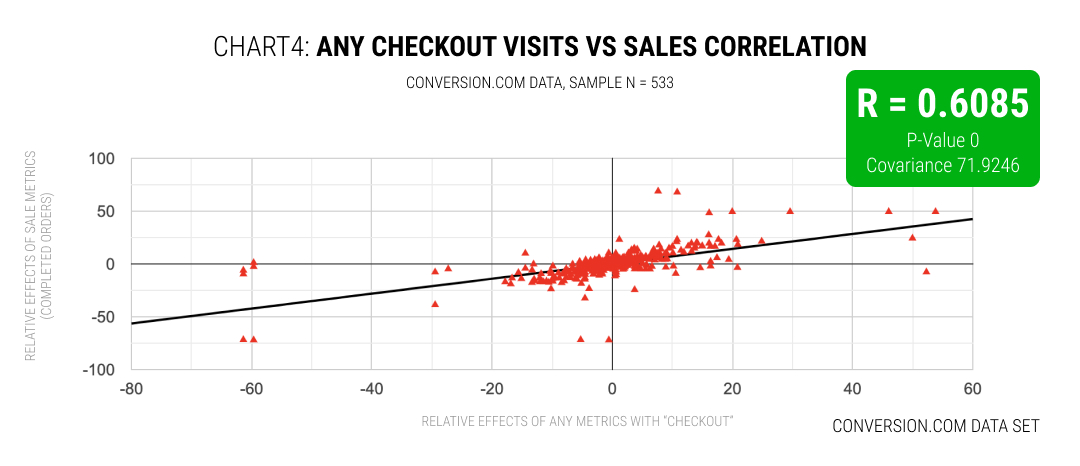
In this fourth analysis, Michael explored a hunch about correlations potentially becoming stronger as customers progress further towards checking out. To confirm this, he agreed to perform one more analysis involving "any checkout visits" vs sales. These checkout metrics included a variety of shallow (early) and deeper (later) checkout step visits across funnels. Interestingly, in this new sample of 533 experiments we can notice the stronger correlation of R = 0.6085 along with an ultra significant result (p-value near 0). So the data confirms Michael's intuition.
What Do Experimenters Think About Relying On Secondary Metrics In A/B Tests?
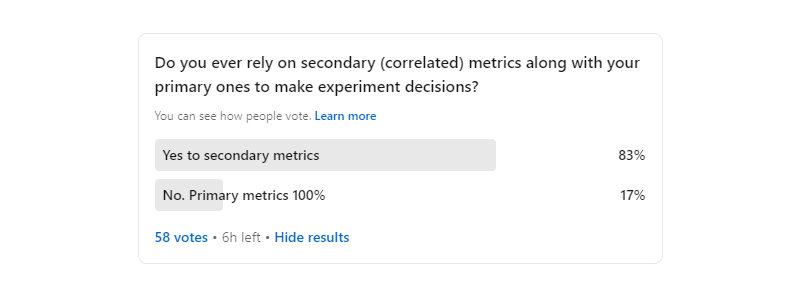
Building on this topic, a week ago I also ran a LinkedIn poll asking if others rely on secondary metrics while making decisions about their a/b tests. According to the poll results, the consensus seems heavily skewed (83%) towards incorporating such metrics.
Now What: How Do We Use These Secondary Metrics?
Here I'd like to explore a few potential use cases as potential starting points or questions. Let's first start with the standard and most basic experiment design where we have a primary metric with some satisfied significance threshold as acceptance criteria. In order for someone to make a decision, it might look like the following:

Secondary As Primary?
This brings us to the first use case where someone might simply not have enough traffic or adequate statistical power in order to detect a desired effect on their primary metrics. Assuming a situation where a secondary metric (such as checkout visits) correlates with sales, isn't it better to run such an a/b test (with the secondary as primary) than no test at all? Please let's also remember that the closer the metric to a sale/order, the higher the correlation (according to Chart 4 and Michael's data from Conversion).
Having said that, here we should also strongly remind ourselves that correlation does not equal causation. And we could easily come up with test ideas where we "artificially" encourage people to move throughout a checkout funnel, without affecting the primary metrics.

Secondary As Guardrail Metrics
Moving on, perhaps a second use case for secondary metrics might include setting them as simple guardrails. That is, our traditional primary metrics stay as such but additional ones are also tracked. These guardrails are then factored into our acceptance criteria. For example: we'll only accept the test if our primary metric is satisfied while additional secondary ones that do not deteriorate (or meet some predefined conditions).

Multiple Secondary Metrics?
Here is a rather exploratory use case for which I lack the math background and is only meant as a question. But let's assume that we had a set of three secondary metrics that we knew all correlated with the primary. Could we minimize uncertainty by making an acceptance decision when all three secondary metrics pointed in the same direction of effect? This is more of a hunch.

Aggregate Metrics?
Similarly to the above exploratory use case, could we combine both secondary and primary metrics in some way to minimize uncertainty and make a better decision, faster? Is there less uncertainty when primary metrics show consistent effects with secondary metrics? Again, here intuition tells me yes, but this is simply an open question.

Secondary As Inspiration
Last but not least, while designing experiments some teams also appended secondary metrics for greater visibility into how people interact (or don't interact) with UI elements. These metrics can later become inspirational sources for follow up experiment iterations. Perhaps a variant might increase error rates, make people edit their carts more often or something else. Such interactions are only visible if measured. Seeing these additional metrics of course can lead to new questions and new experiments. So secondary metrics here might act as bridges for iteration.

This analysis does begin to show consistently across data sets that some metrics may be correlated with varying degrees. My judgement on this is it would probably be better to rely on such a secondary metric than no metric at all. At the same time we should stay aware that not all add-to-cart increases will lead to increases in sales as correlation doesn't equal causation. Hopefully these data sets inspire further analysis.
 Jakub Linowski on Nov 30, 2023
Comments