Do Some Sources Of Experiment Ideas Lead To Higher Win Rates Than Others?
One way an experimentation program may be improved is by tracking its “win” rate while checking for variables that may affect it — essentially an observational study. Driven by this curiosity I reached out to a handful of companies that began collecting such win rate data, specifically around the sources of their experiment ideas. I began to ask: are there some sources of experiment ideas that might signal in the direction of a higher or lower win rate? And here is what I found.
Idea Sources And Win Rates
The first data set comes from Michael St Laurent of Conversion.com who already shared interesting win-rate data previously on LinkedIn. In this updated set however we can see information about win rates broken down by different idea sources. These include:
- Copy Competitor - The idea is sourced by a competitive brand that is using a certain design pattern or technique
- Analytics - The idea is backed by quantitative analytics data (Ex. Funnel analysis, click-stream data)
- Test Archive - The idea is sourced from a previously executed experiment
- UX Research - The idea is sourced from a source of user research (Ex. User Interviews)
- Psychology - The idea is supported by a widely understood cognitive bias or psychological principle (Ex. Anchoring, Social Proof, etc.)
- Gut Feeling - The idea is not supported by anything in particular. We are just guessing.
- Best Practice (Popularity) - The idea is a widely considered best practice pattern (Ex. No carousels) or from an established UX library (Ex. NN Group, Baymard)
More so, win-rate was determined using omni-directional effects, any primary metrics, while achieving a stat-sig result (p 0.05). Outliers were also removed from the data set.
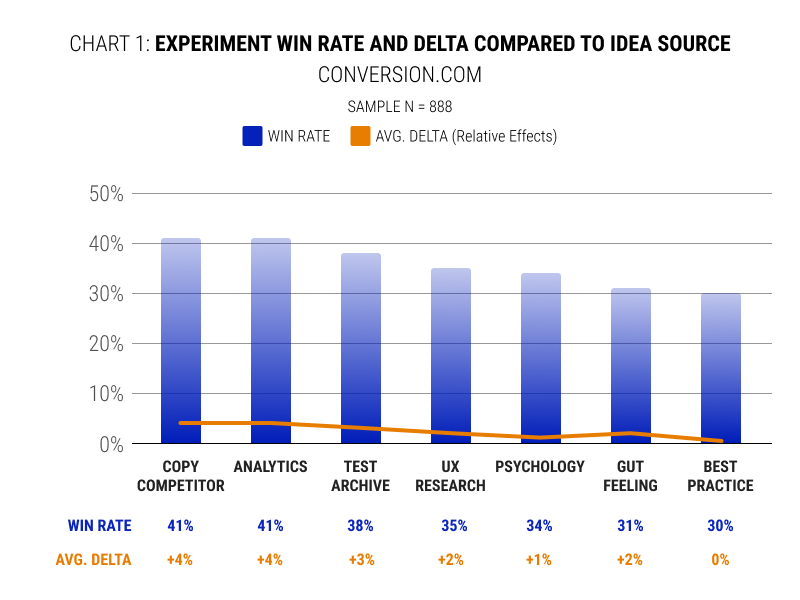
From these results we can see that such sources as copying competitors, analytics, using test archives and UX research have a tendency to increase the odds of an impactful experiment.
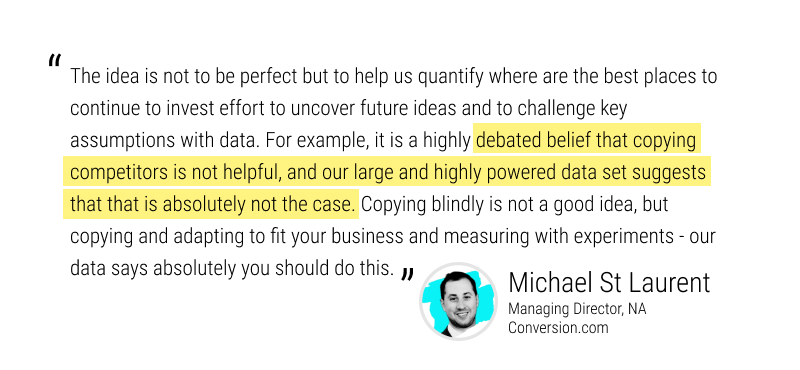
About Following Taillights (Copying Stats-savvy Competitors)
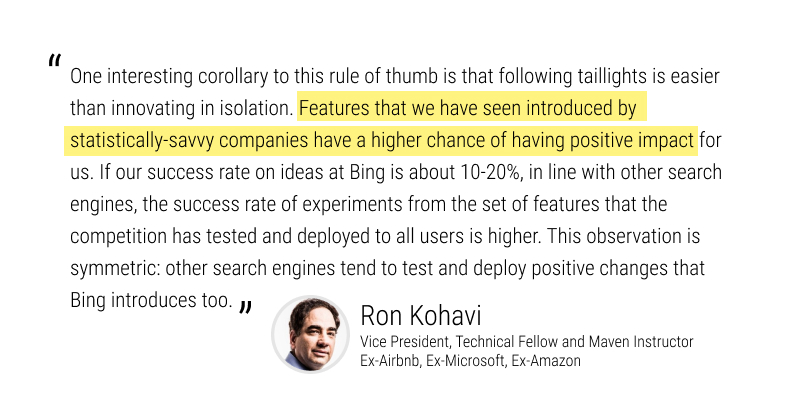
Building on the highest performing idea source (copying competitors) in Michael's data, there are parallels with what Ron Kohavi observed while at Bing. In Seven Rules of Thumb for Web Site Experimenters Ron writes that there is signal in testing what others leading experimentation companies have tested and rolled out. In essence, this is the exact same reason why I began reporting on so called "leaked" experiments where prominent a/b tests make themselves publicly visible.
Ron Kohavi also teaches a high quality class on A/B testing here.
How About Individuals Vs Teams?
The next data set has been shared by Lucia van den Brink of Increase Conversion Rate. She has been collecting win rates of experiments while comparing individual vs team based programs. On individual (or personal) projects, there was only a single person coming up with the ideas (brainstorming, concepting and prioritization). Whereas on team-based projects the sources of ideas came from a wider range of people with room for team based feedback and prioritization.
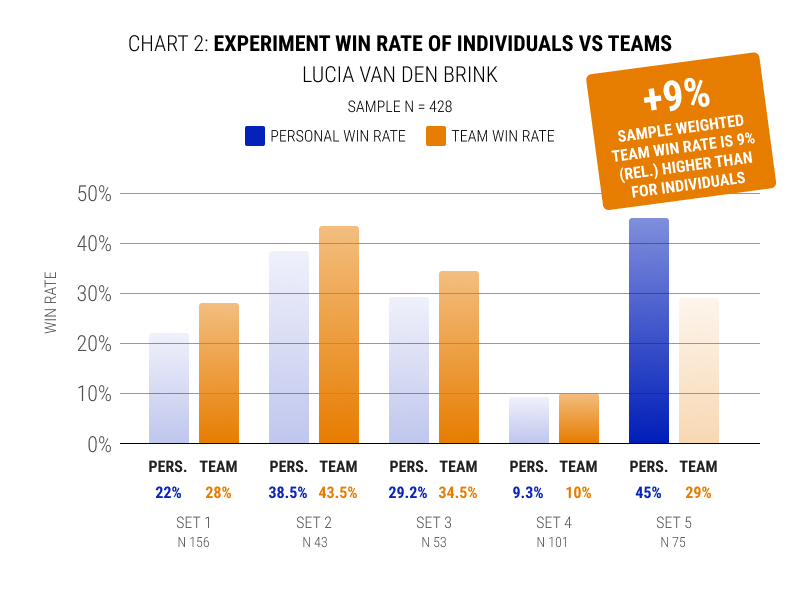
What Lucia found was that out across 5 sets of projects (defined by different clients), in 4 out of the 5 cases, increases in win rates were observed in team-based experiments compared to the individual ones. Since Lucia also collected sample sizes for each set, I calculated the relative sample weighted average for the combined data which came out to be an improvement a +9% higher win rate for teams.
Lucia has also shared her thoughts on the collaboration bonus in other presentation on her website.
Interestingly, not all of the team-based projects lead to an increase in win rate. When we look at the last set, we can see a -35.5% relate win rate decrease (between 45% for the individual and 29% for the team). Lucia hinted that this may have been as a result of her starting with a client where she (as the individual) brought a lot of "prior knowledge from past a/b tests" while the team was relatively new to a/b testing. In the first 1-4 sets however, the team had a higher level of experience and prior knowledge of a/b test results.
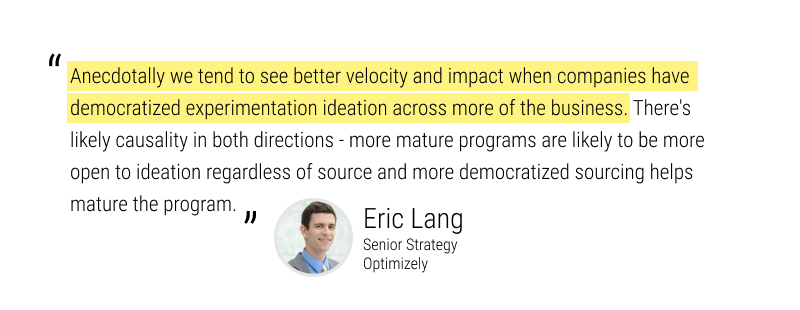
Eric Lang from Optimizely also shared an anecdote in regards to Lucia's observation - reinforcing the idea that democratized ideations processes come with higher impacts (and implied win-rate increases).
Research Sources And Win Rates
The Further research team (Kara Fecteau, Caroline Brewer and Nick Murphy) also shared their win-rate data after tracking 102 experiments. They defined win-rate as tests with a p-value of 0.1 and tagged their experiments with the following criteria around sources of research type:
- Previous Test Iteration - Taking an experiment and iterating on it.
- Digital Behavioral Analysis This ideation method is the only one that both helps you identify problems on your site and estimate how much lift you might create by addressing it.
- Comparative Analysis - Research a range of sites to understand the experiences that customers are accustomed to seeing and likely to expect.
- Heatmap/Session Replay - Heatmaps are used to showcase where users are clicking/scrolling on your website. Session replays are recordings of actual customer website sessions.
- Heuristic Analysis - Get past biases and limited perspectives. Reduce the influence of our feeble human leanings with frameworks for evaluating digital experiences against a body of research and industry expertise.
- Voice of Customer (VoC Analysis) - Understand customer pain points as voiced by the customer through qualitative and quantitative data. Assess the salience and severity of identified issues.
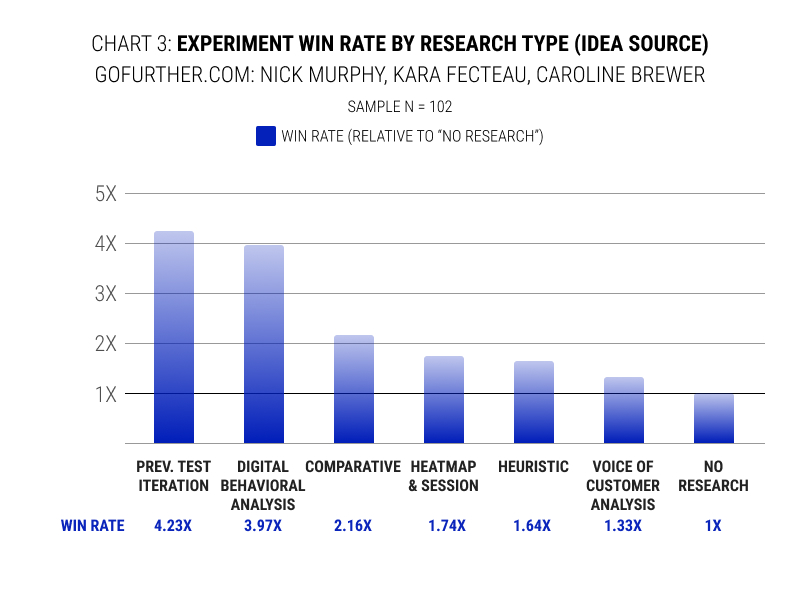
From this data we can see that iterating on a prior experiment had some of the highest odds of success for the Further team. This might very well be similar to Michael's data in the first chart where they equally observed a higher win rate (38%) for "test archive" inspired experiments.
Experiments without any inputs (closest to random) had the lowest relative win rates.
With And Without Analytics
Next, we also also highlight observation made by Optimizely as they were published in their 2023 Evolution of Experimentation benchmark report. Their compared teams which did not have analytics enabled vs ones that did, and ones that also used heatmaps. Analytics here is seen as an ability to export and segment the data to help identify further insights.
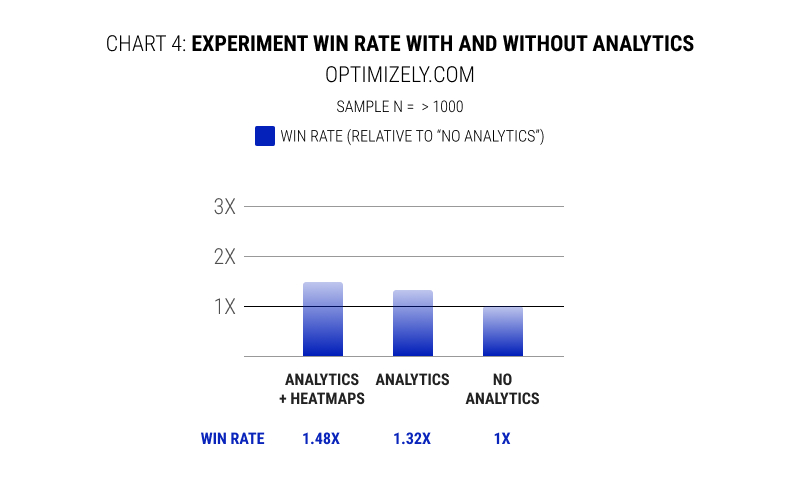
What Optimizely found was that teams that used analytics as inputs had a 32% higher win rate compare to no analytics at all. Teams that also had heatmaps enabled, saw their win rate increase by 48%.
In Summary
When looking across all of the above data, we can see that the lowest win-rate is usually linked with experiments with the least number of inputs. That is: siloed individuals (Lucia / Increase Conversion Rate), exclusively relying on gut feelings or best/popular practices (Michael / Conversion.com), no research (Nick's / Further), and no analytics (Optimizely).
Whereas the opposite is also true, with the highest win-rate experiments usually having more inputs from past evidence, data and teams. That is: team-based experimentation programs (Lucia / Increase Conversion Rate), inputs from competitors that run experiments, research or prior a/b tests data (Michael / Conversion.com), test iterations or research inspired experiments (Nick's / Further)and analytics inspired experiments (Optimizely).
 Jakub Linowski on Feb 20, 2024
Comments