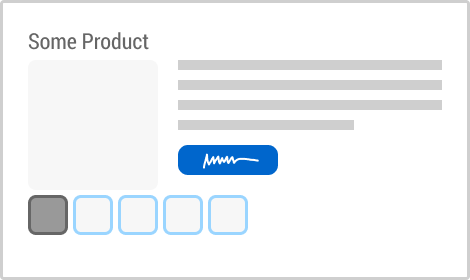
Pattern #95: Product Previews

Pattern #95  Tested 3 timesFirst tested by Vito Mediavilla Recently tested by Melina Hess on Jun 09, 2023

Based on 3 Tests, Members See How Likely Version B Wins Or Loses And By How Much

LOSSES
-5
-4
-3
-2
-1
FLAT
+1
+2
+3
+4
+5
WINS

Measured by the sum of negative and positive tests.

A B
Product Previews (Variant A) Product Previews (Variant B)

Expected Median Effects Of B

-

Progression

?

Leads

(1 tests)

-

Signups

?

Engagement

(1 tests)

?

Sales

(2 tests)

-

Revenue

-

Retention

-

Referrals

?

ANY PRIMARY

(3 tests)

Tests

Pattern #95: Product Previews
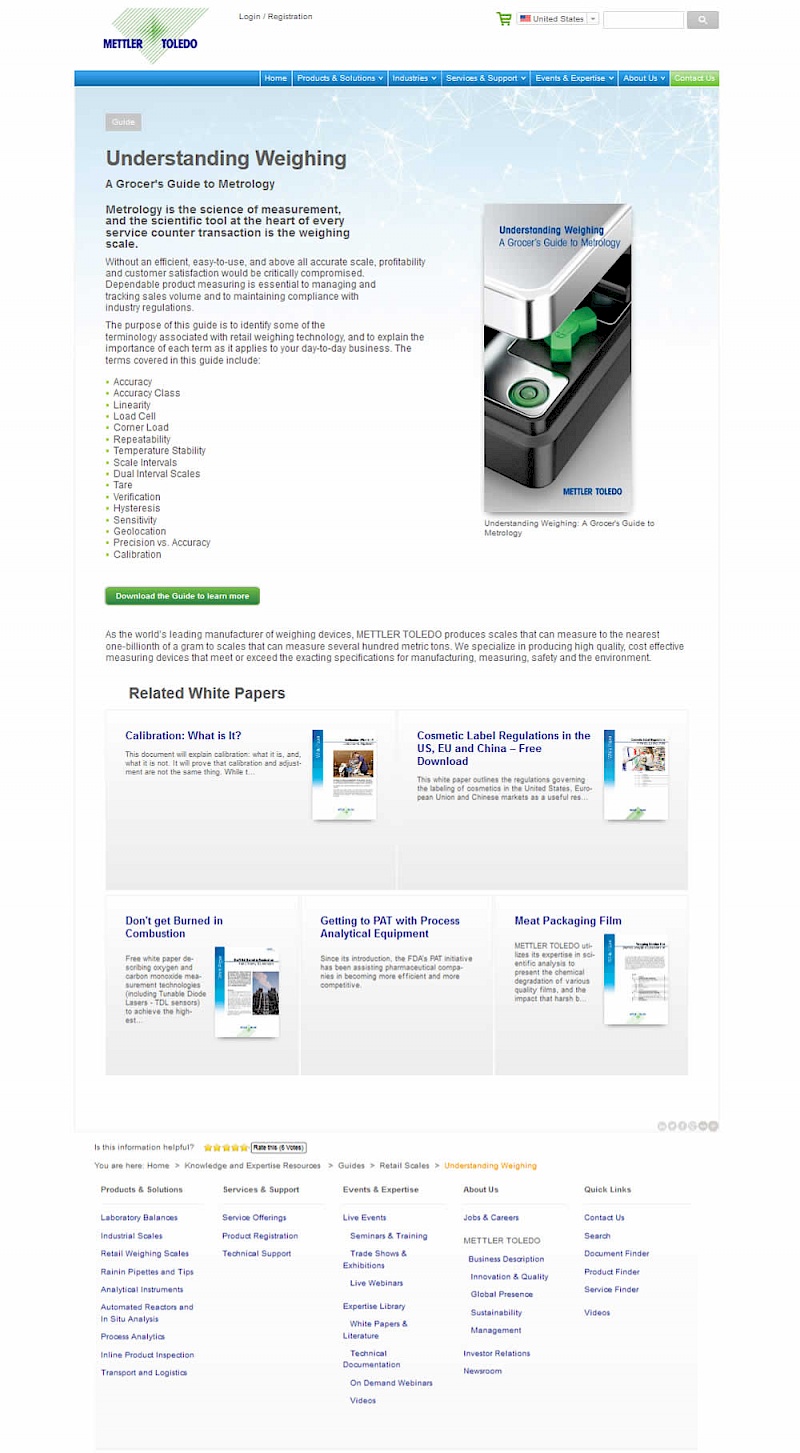
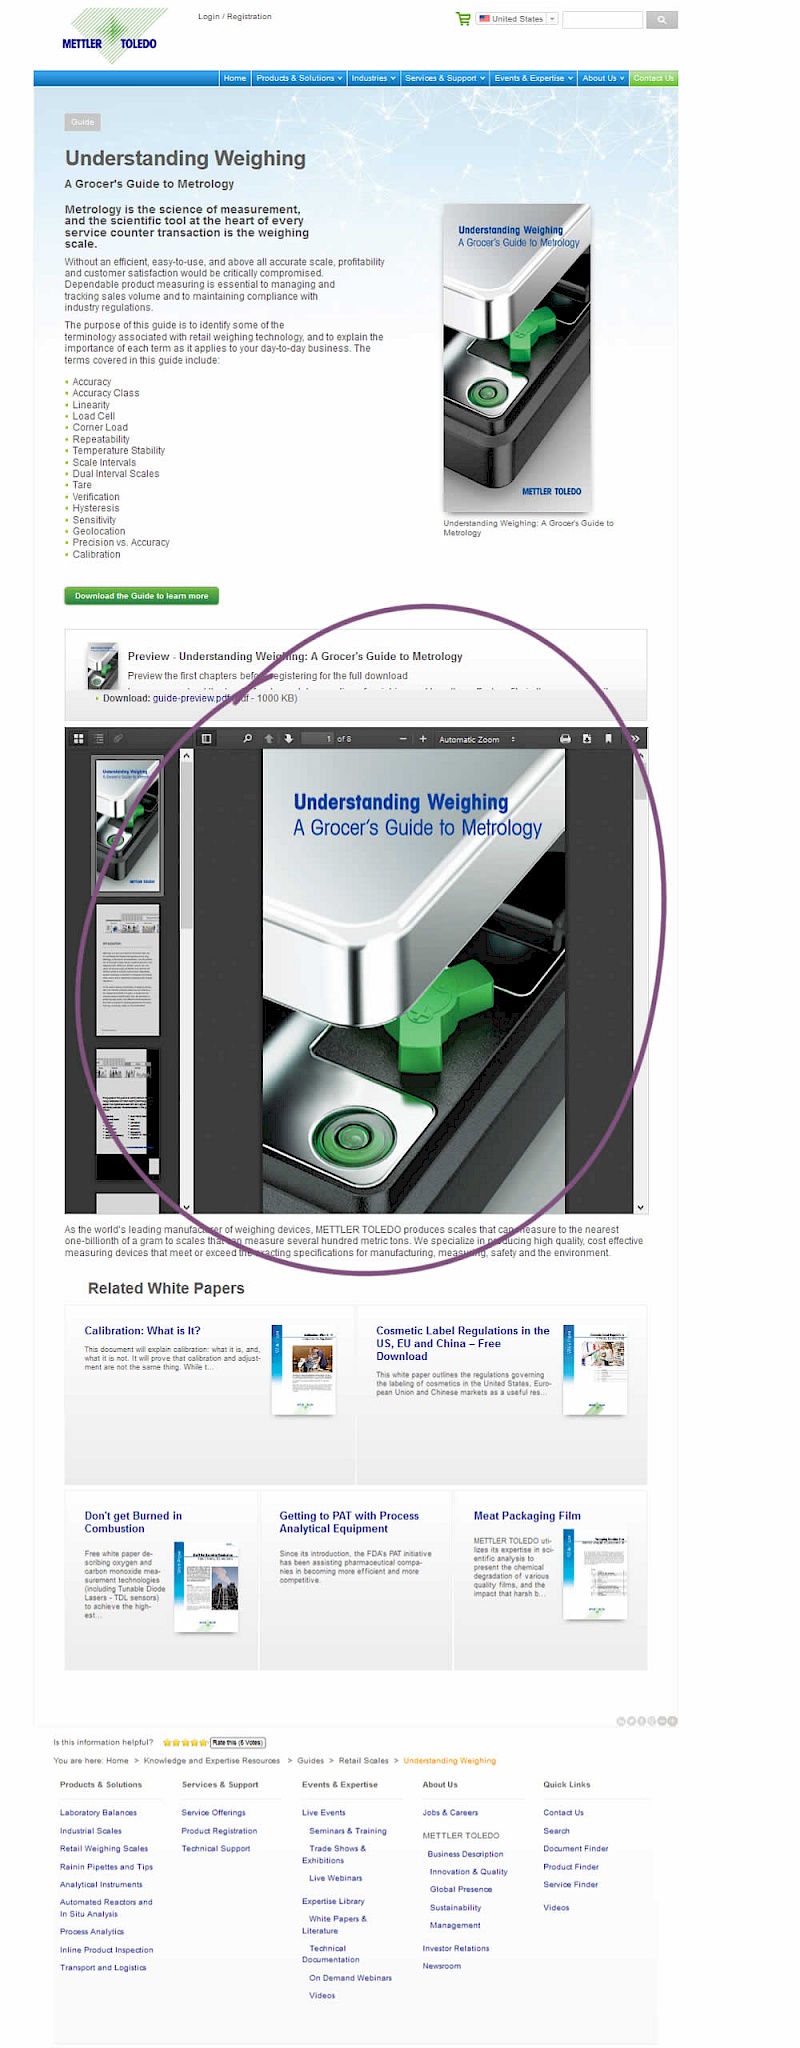
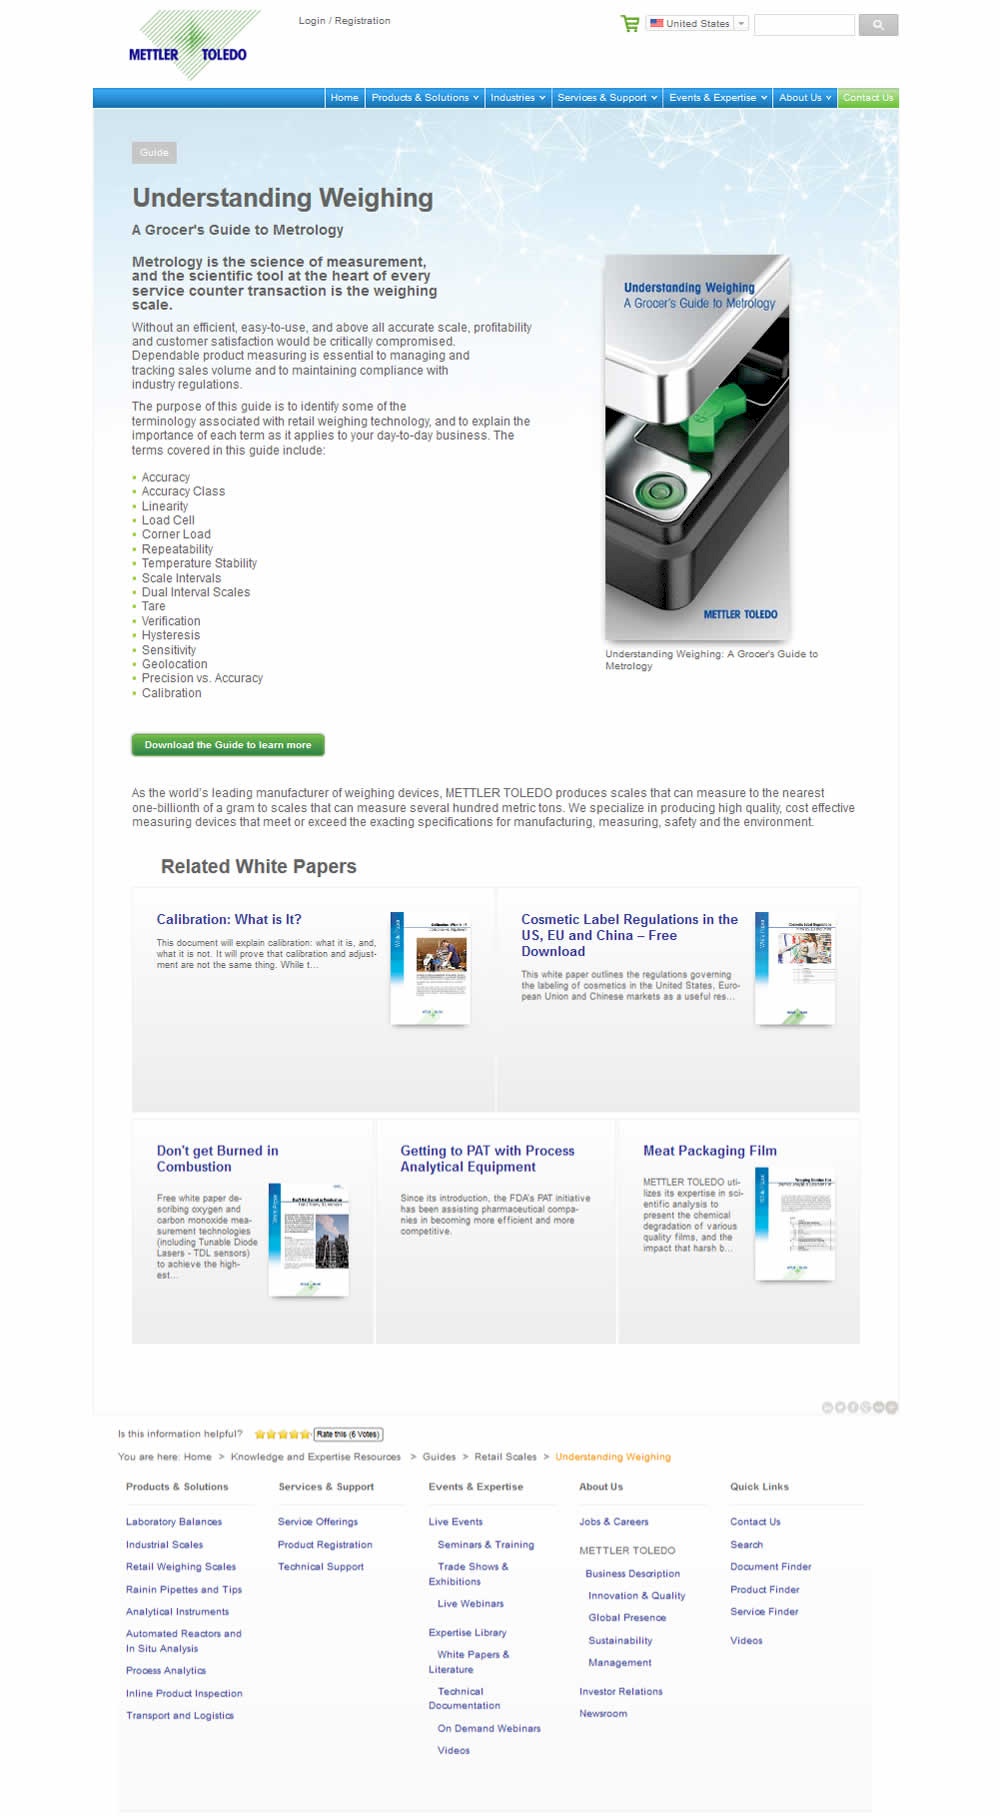
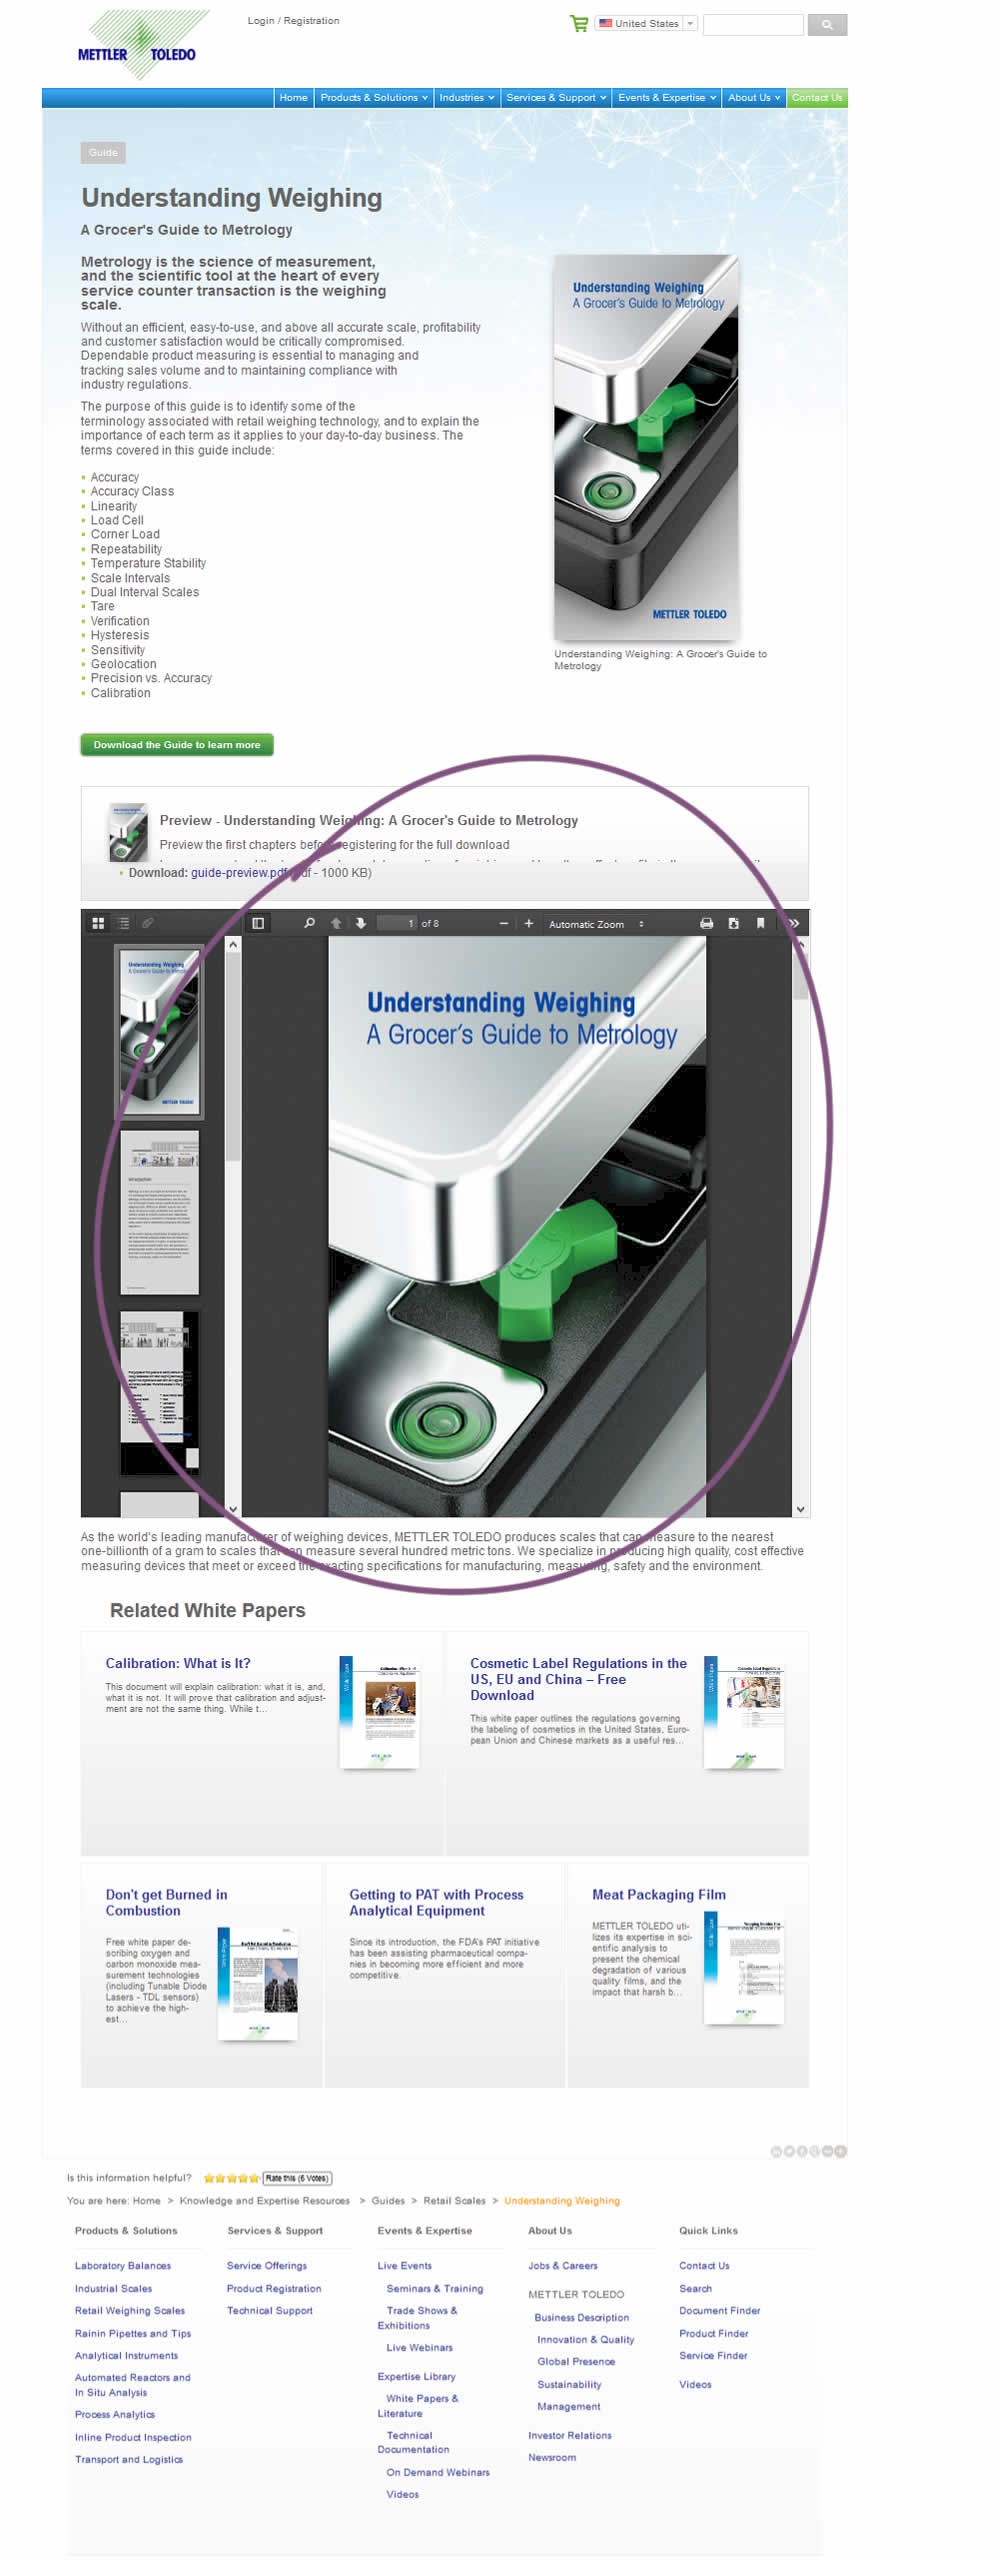
Was Tested On Mt.com by Vito Mediavilla

Added

Isolated

Test # 219 on Mt.com by $conducted_test->test->user_->first_name . ' ' . $conducted_test->test->user_->last_name Vito Mediavilla    Jan 14, 2019 Test link

Find Out How It Did With 4,836 Visitors

  • Measured by lead generation starts (clicks on button)

  • Measured by successful form completions

Get Access To See The Test Results

The Same Pattern Was Also Tested Here

Replaced

Isolated

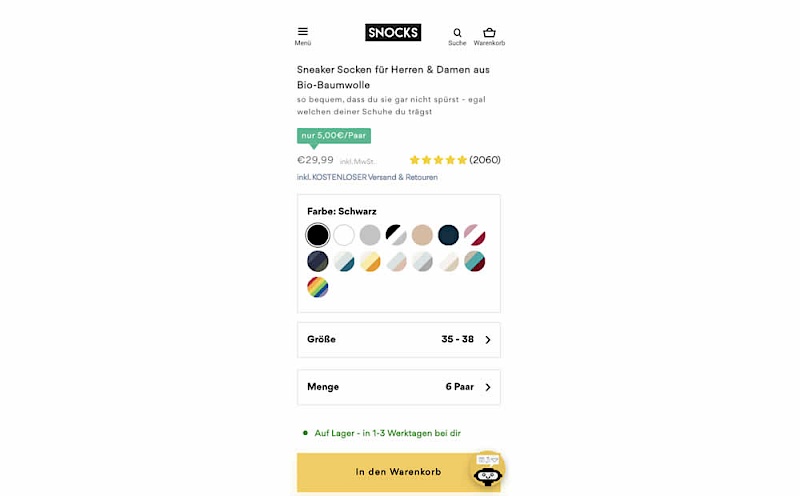
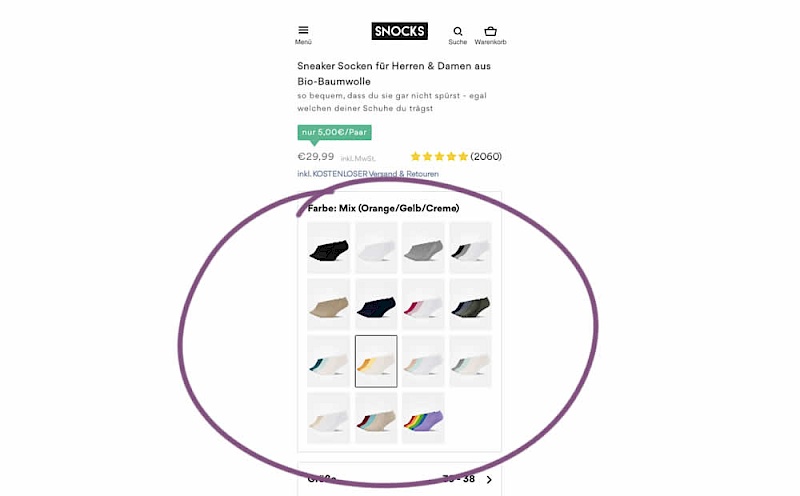
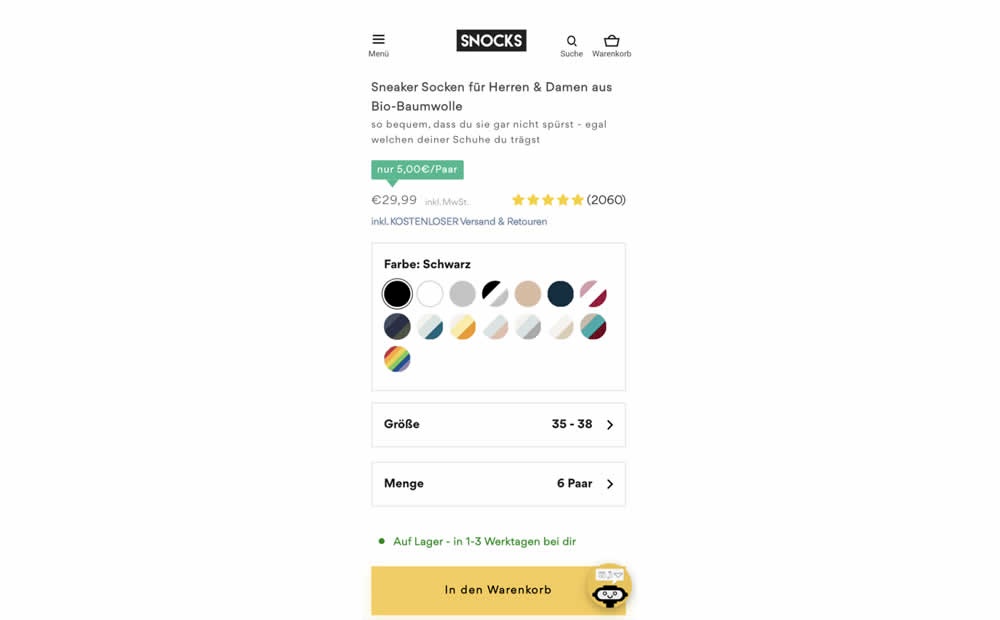
Test # 477 on Snocks.com by $conducted_test->test->user_->first_name . ' ' . $conducted_test->test->user_->last_name Melina Hess    Jun 09, 2023 Test link

Find Out How It Did With 916,207 Visitors

  • Measured by completed orders

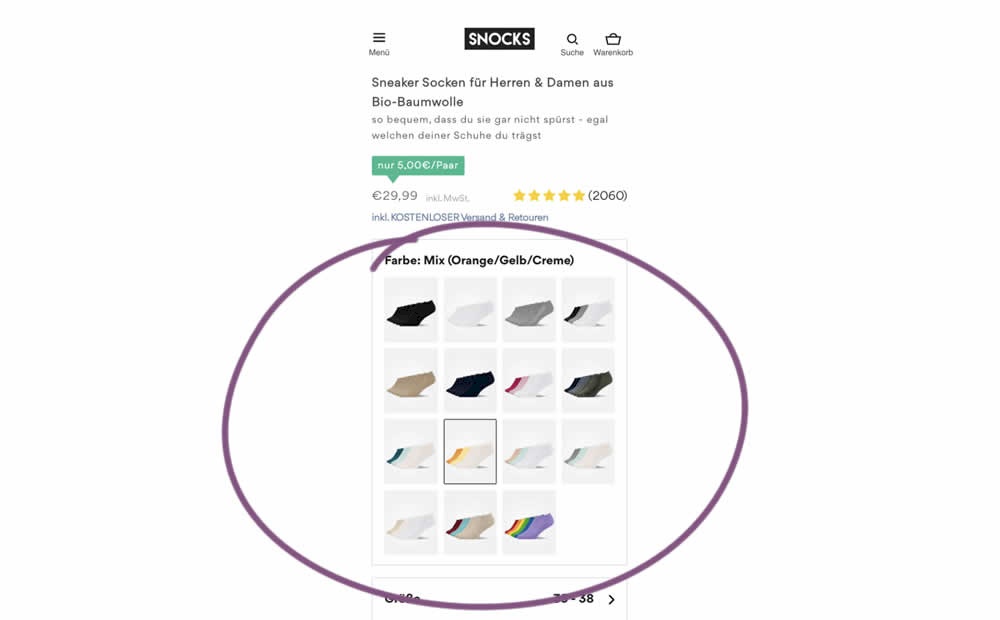
In this experiment, product color swatches were replaced with real product photos. Whereas the control showed the colors as more abstract circles. Impact on sales was measured.

Get Access To See The Test Results

Replaced

Isolated

Test # 476 by $conducted_test->test->user_->first_name . ' ' . $conducted_test->test->user_->last_name Devesh Khanal    Jun 08, 2023 Test link

Find Out How It Did With 848,081 Visitors

  • Measured by completed transactions

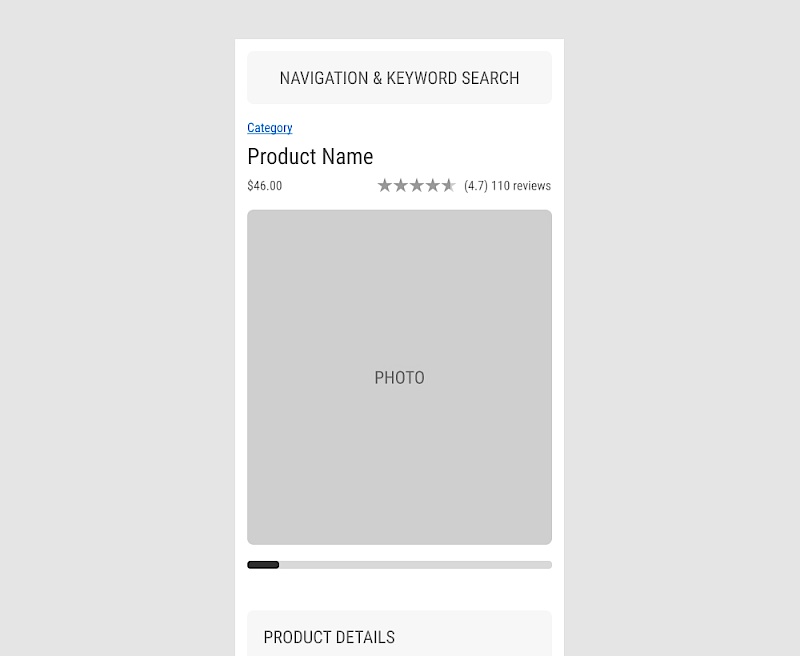
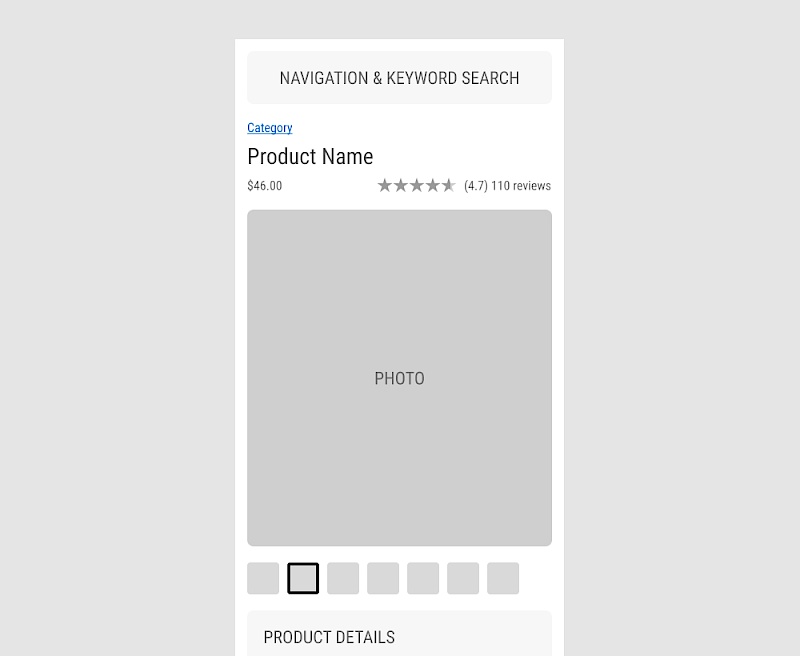
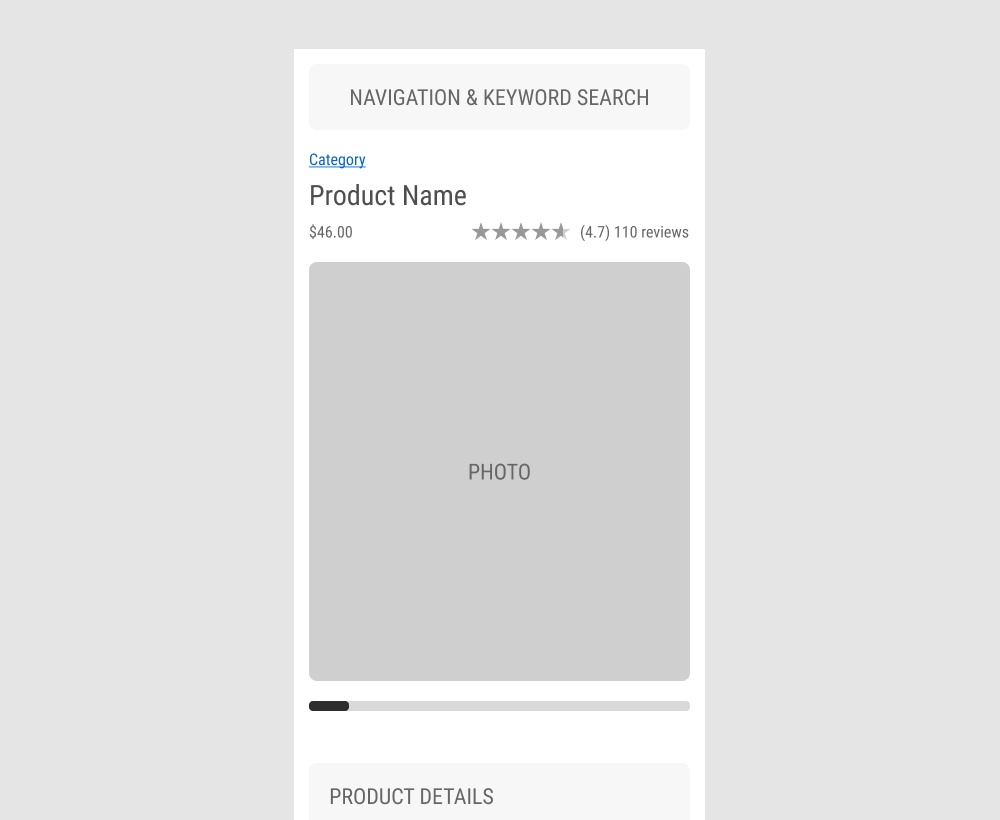
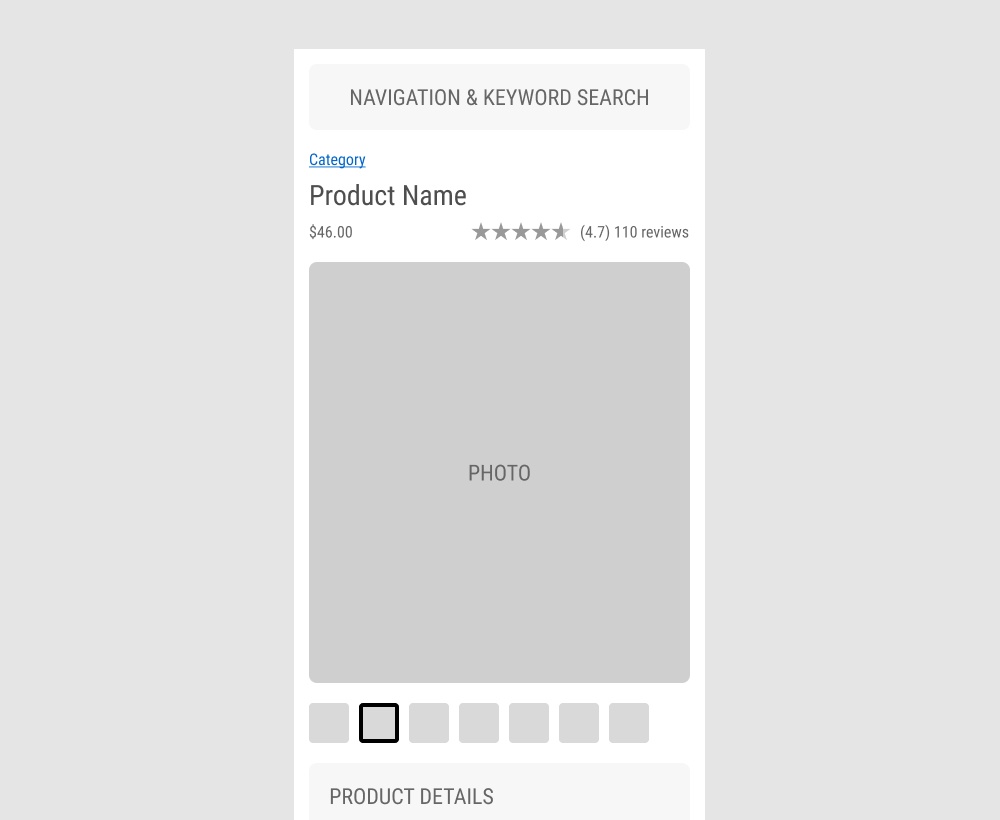
The GrowthRock team ran an experiment on one of their client's product detail pages. Instead of using a scrollbar (for mulitple images), clickable product photo thumbnails were used instead. Impact on sales was measured.

Get Access To See The Test Results

For each pattern, we measure three key data points derived from related tests:

REPEATABILITY - this is a measure of how often a given pattern has generated a positive or negative effect. The higher this number, the more likely the pattern will continue to repeat.

SHALLOW MEDIAN - this is a median effect measured with low intent actions such as initiating the first step of a lengthier process

DEEP MEDIAN - this is derived from the highest intent metrics that we have for a given test such as fully completed signups or sales.