Beating Chance With Conversion Patterns: Our 2017 Q1 Win Rate Report
Chances are that some of your recommended UI changes will lead to improvements while others will simply make things worse. In my own line of work, I also wish to get better at predicting and launching winning tests. Therefore, in Q1 of 2017 we started using conversion patterns as a core tool to increase our win rate and here is how well we've done so far.
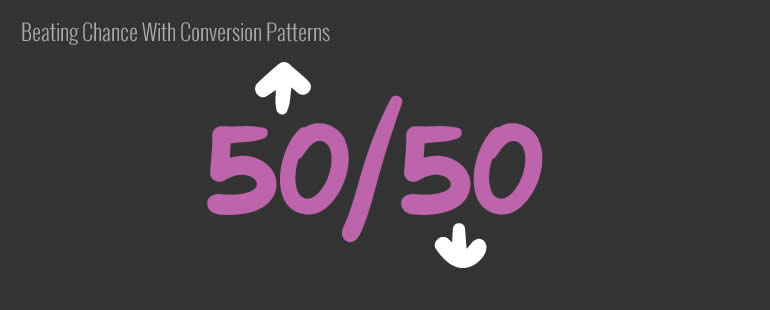
50/50 Chance To Start
As a start, let's imagine that your UI changes are based on pure randomness alone. In this scenario we might expect a 50/50 chance for the effect to be either positive or negative. It's not difficult to see that such random behavior might be a rather hard sell to a client or boss. Making random recommendations and changes, given enough time might lead to an outcome where the good work will be eventually cancelled out by the equally bad work that follows - a depressing scenario. And so I think we can and should aim to do better than 50/50.
Better Than 50/50
To be fair, it’s rather unlikely that you or I would rely on pure randomness for our design decision making alone. Instead we educate ourselves by taking courses, absorb knowledge from books, improve our processes, imitate the success of others and tap into research (usability studies, customer research) all in order to generate more positive effects than not. With these activities our odds of changing things for the better should increase. However to truly answer this we need to reflect back and evaluate our tools and processes.
67/33 Win Rate With Conversion Patterns
My own professional work is in conversion rate optimization where I’m equally interested in beating chance. Knowing and predicting which UI changes (usually A/B tested) will lead to positive effects is good business (especially when billing by performance). So in Q1 of 2017 we started evaluating if conversion patterns in particular could help us win more often. To do this, we started recording a specific class of a/b tests that were strictly inspired by patterns based on past test data. After running 21 A/B tests that all were predicted to bring positive results, 67% of these tests did. We beat chance with conversion patterns by 67/33.
Conversion Patterns Explained
The true power a conversion pattern comes from its real test data that it is based on. Each pattern that we define contains two key attributes which does the predictive work for us: 1) the degree of reproducibility (or certainty) and 2) a median effect. Both are measured from a/b tests that are similar to the pattern itself.
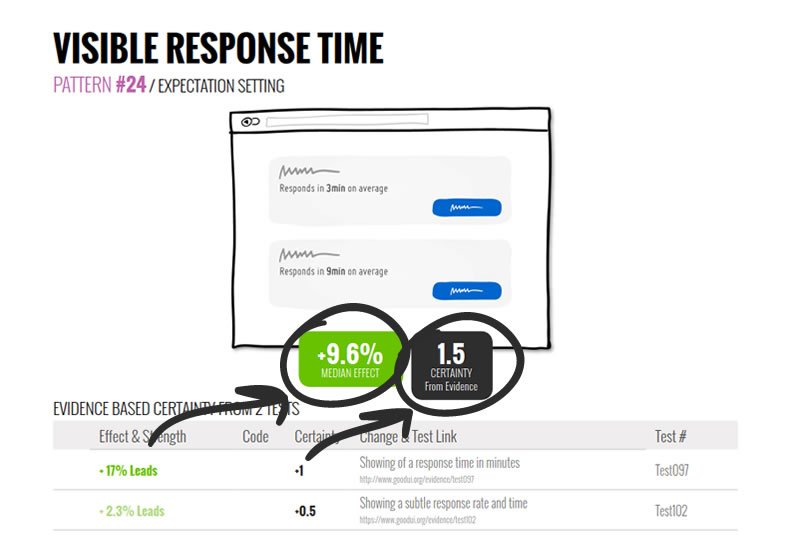
1. Degree Of Reproducibility (Certainty)
The degree of reproducibility is an index of how many similar and total tests we know of that have won (or lost) in the past. So if we have 3 tests for a pattern of which 2 won and 1 lost, we will have a net 1 reproducibility score (2-1=1). We also account for significance by assigning smaller values to less significant tests. We measure reproducibility with the assumption that the more something works, the more it will work in the future. In the long run as we collect more tests for a given pattern, some will repeat more than others. These higher reproducing tests I believe should also have more predictive power - time will tell.
2. Median Effect
The median effect is also measured for each pattern from the tests its based on. It's equally important as it allows us to gauge what relative effect we can expect from a given change. This measure allows us to further evaluate which patterns may be better (a +20% increase pattern is better than a +2% one, and much easier to detect). As a pattern is based on more tests, the median value should become more predictive in terms of its effect size.
Question 1: Can Conversion Patterns Improve Our Win Rate?
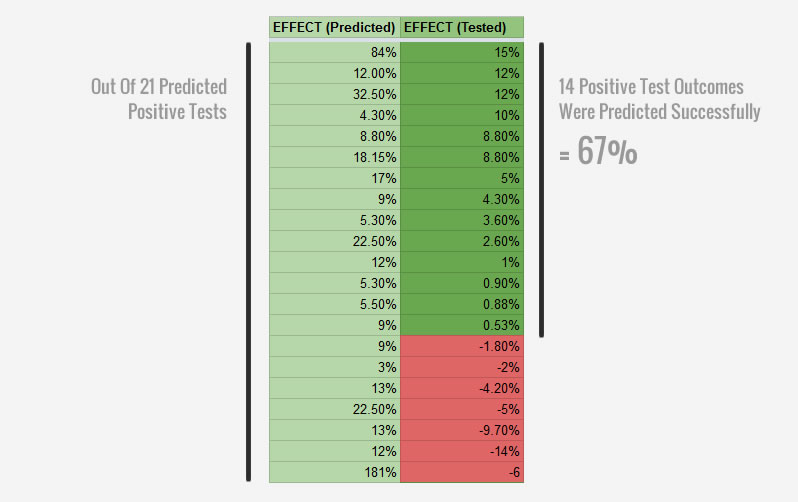
This brings me to one of the key questions: can conversion patterns improve our win rate and help us do better than 50/50? Here are the results of 21 tests we ran in Q1 of 2017. All 21 tests were based on conversion patterns that were predicted to win. That is, the patterns on which these tests were based on informed us that they had a positive median effect and a positive reproducibility score. Out of these 21 tests, 14 tests had a positive effect at the time of stopping. That's a 67% win rate. To me this is a very good indication that such patterns are effective at increasing the win rate of a/b tests.
Question 2: Does A Higher Reproducibility Lead To A Higher Win Rate?
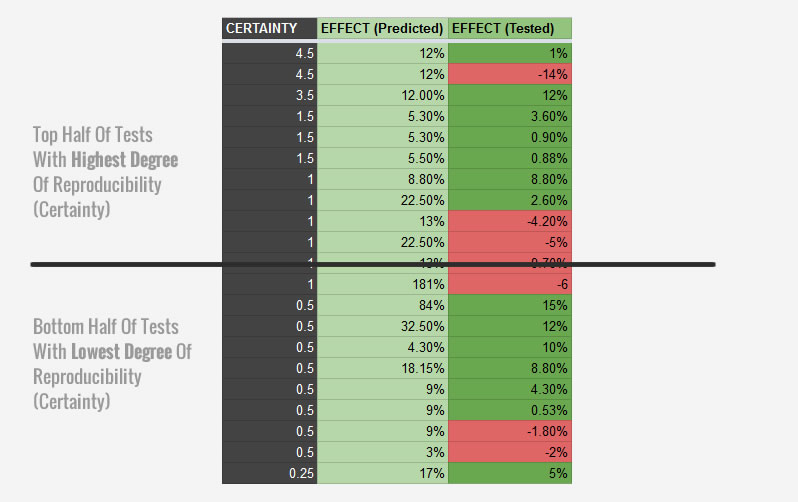
The other equally interesting question which I'd like to answer is whether patterns with a higher reproducibiltiy can be even more effective at predicting positive test outcomes? To answer this, we sorted the 21 a/b tests by the degree of reproducibility (certainty) and compared both top and bottom halves of the predicted results. The top half (with the higher reproducibility scores) contained 7 winning tests, whereas the bottom half contained 7. With this simple analysis, there is no difference between the top and bottom halves. This is something I will be looking for in future tests and analysis.
Much Optimism For The Future
This first assessment of conversion patterns is very promising to me. So far it looks like a systematic analysis of past test data can be a powerful tool in predicting test outcomes and making CRO work easier. I hope to keep measuring this approach and share more updates in future quarters to come.
But What About Significance?
I can see a question brewing on the horizon. We might have evaluated which tests were positive or negative, but we have not evaluated how significant the test results were - how come?
The answer is that significance comes with time and it's not always something we are in control of. The tests which we evaluated were sometimes ran by us as consultants, and at other times we inspired through mentorships.
For the tests that we ran with our clients, we might have called them early (or optimally) in the interest of time. This we do in order to benefit and exploit the insight earlier when it’s "good enough". In this scenario although significance is important, it's never a stopping or implementation rule. It's normal for us to call a winning test with a positive effect that was only suggestive (or partially significant).
For the tests that we inspired through mentorships, we simply are not always in control of stopping them as they are managed by other individuals.
Significance is also not the best indicator of success since it's a function of time. If you run a test long enough it will become significant given enough time: weeks, months, years or decades. The lower the effect the more time it needs to reach significance, but it will eventually do so.
Finally, the degree of significance varies from organization to organization. What one company accepts as good enough will differ to another.
Since significance is so variable across projects and organizations, we decided to cut it out of our evaluation and only looked at whether a test is positive or negative.
Updated: July 11, 2017
After redoing the analysis for Q1, I have to admit that I miscalculated one positive test which should have been a negative test. This means our win rate is actually 14 our of 21 tests (that's 67%). Still good, but a little lower.
We also have continued with a similar analysis for tests in Q2.
Get The Patterns That We Use To Win More Often
Back To You: How Well Are Your Tools Performing?
How do you evaluate your own tools or processes in helping you improve over time? Are you tracking your a/b testing performance in any way? Please share, I’d love to find out.
Chances are that some of your recommended UI changes will lead to improvements while others will simply make things worse. In my own line of work, I also wish to get better at predicting and launching winning tests. Therefore, in Q1 of 2017 we started using conversion patterns as a core tool to increase our win rate and here is how well we've done so far.
50/50 Chance To Start
As a start, let's imagine that your UI changes are based on pure randomness alone. In this scenario we might expect a 50/50 chance for the effect to be either positive or negative. It's not difficult to see that such random behavior might be a rather hard sell to a client or boss. Making random recommendations and changes, given enough time might lead to an outcome where the good work will be eventually cancelled out by the equally bad work that follows - a depressing scenario. And so I think we can and should aim to do better than 50/50.
Better Than 50/50
To be fair, it’s rather unlikely that you or I would rely on pure randomness for our design decision making alone. Instead we educate ourselves by taking courses, absorb knowledge from books, improve our processes, imitate the success of others and tap into research (usability studies, customer research) all in order to generate more positive effects than not. With these activities our odds of changing things for the better should increase. However to truly answer this we need to reflect back and evaluate our tools and processes.
67/33 Win Rate With Conversion Patterns
My own professional work is in conversion rate optimization where I’m equally interested in beating chance. Knowing and predicting which UI changes (usually A/B tested) will lead to positive effects is good business (especially when billing by performance). So in Q1 of 2017 we started evaluating if conversion patterns in particular could help us win more often. To do this, we started recording a specific class of a/b tests that were strictly inspired by patterns based on past test data. After running 21 A/B tests that all were predicted to bring positive results, 67% of these tests did. We beat chance with conversion patterns by 67/33.
Conversion Patterns Explained
The true power a conversion pattern comes from its real test data that it is based on. Each pattern that we define contains two key attributes which does the predictive work for us: 1) the degree of reproducibility (or certainty) and 2) a median effect. Both are measured from a/b tests that are similar to the pattern itself.
1. Degree Of Reproducibility (Certainty)
The degree of reproducibility is an index of how many similar and total tests we know of that have won (or lost) in the past. So if we have 3 tests for a pattern of which 2 won and 1 lost, we will have a net 1 reproducibility score (2-1=1). We also account for significance by assigning smaller values to less significant tests. We measure reproducibility with the assumption that the more something works, the more it will work in the future. In the long run as we collect more tests for a given pattern, some will repeat more than others. These higher reproducing tests I believe should also have more predictive power - time will tell.
2. Median Effect
The median effect is also measured for each pattern from the tests its based on. It's equally important as it allows us to gauge what relative effect we can expect from a given change. This measure allows us to further evaluate which patterns may be better (a +20% increase pattern is better than a +2% one, and much easier to detect). As a pattern is based on more tests, the median value should become more predictive in terms of its effect size.
Question 1: Can Conversion Patterns Improve Our Win Rate?
This brings me to one of the key questions: can conversion patterns improve our win rate and help us do better than 50/50? Here are the results of 21 tests we ran in Q1 of 2017. All 21 tests were based on conversion patterns that were predicted to win. That is, the patterns on which these tests were based on informed us that they had a positive median effect and a positive reproducibility score. Out of these 21 tests, 14 tests had a positive effect at the time of stopping. That's a 67% win rate. To me this is a very good indication that such patterns are effective at increasing the win rate of a/b tests.
Question 2: Does A Higher Reproducibility Lead To A Higher Win Rate?
The other equally interesting question which I'd like to answer is whether patterns with a higher reproducibiltiy can be even more effective at predicting positive test outcomes? To answer this, we sorted the 21 a/b tests by the degree of reproducibility (certainty) and compared both top and bottom halves of the predicted results. The top half (with the higher reproducibility scores) contained 7 winning tests, whereas the bottom half contained 7. With this simple analysis, there is no difference between the top and bottom halves. This is something I will be looking for in future tests and analysis.
Much Optimism For The Future
This first assessment of conversion patterns is very promising to me. So far it looks like a systematic analysis of past test data can be a powerful tool in predicting test outcomes and making CRO work easier. I hope to keep measuring this approach and share more updates in future quarters to come.
But What About Significance?
I can see a question brewing on the horizon. We might have evaluated which tests were positive or negative, but we have not evaluated how significant the test results were - how come?
The answer is that significance comes with time and it's not always something we are in control of. The tests which we evaluated were sometimes ran by us as consultants, and at other times we inspired through mentorships.
For the tests that we ran with our clients, we might have called them early (or optimally) in the interest of time. This we do in order to benefit and exploit the insight earlier when it’s "good enough". In this scenario although significance is important, it's never a stopping or implementation rule. It's normal for us to call a winning test with a positive effect that was only suggestive (or partially significant).
For the tests that we inspired through mentorships, we simply are not always in control of stopping them as they are managed by other individuals.
Significance is also not the best indicator of success since it's a function of time. If you run a test long enough it will become significant given enough time: weeks, months, years or decades. The lower the effect the more time it needs to reach significance, but it will eventually do so.
Finally, the degree of significance varies from organization to organization. What one company accepts as good enough will differ to another.
Since significance is so variable across projects and organizations, we decided to cut it out of our evaluation and only looked at whether a test is positive or negative.
Updated: July 11, 2017
After redoing the analysis for Q1, I have to admit that I miscalculated one positive test which should have been a negative test. This means our win rate is actually 14 our of 21 tests (that's 67%). Still good, but a little lower.
We also have continued with a similar analysis for tests in Q2.
Get The Patterns That We Use To Win More Often
Back To You: How Well Are Your Tools Performing?
How do you evaluate your own tools or processes in helping you improve over time? Are you tracking your a/b testing performance in any way? Please share, I’d love to find out.
Posted by  Jakub Linowski on Jun 26, 2017
Comments