Last year, over 100 professionals participated in this study, making 1,391 guesses about the outcomes of 13 completed A/B tests. The goal was to better understand how accurately people estimate real A/B test effects. The study was inspired by a previously discovered signal around guessing directionality. I also wanted to see whether experience and crowd intelligence play a role in minimizing error.
The Method
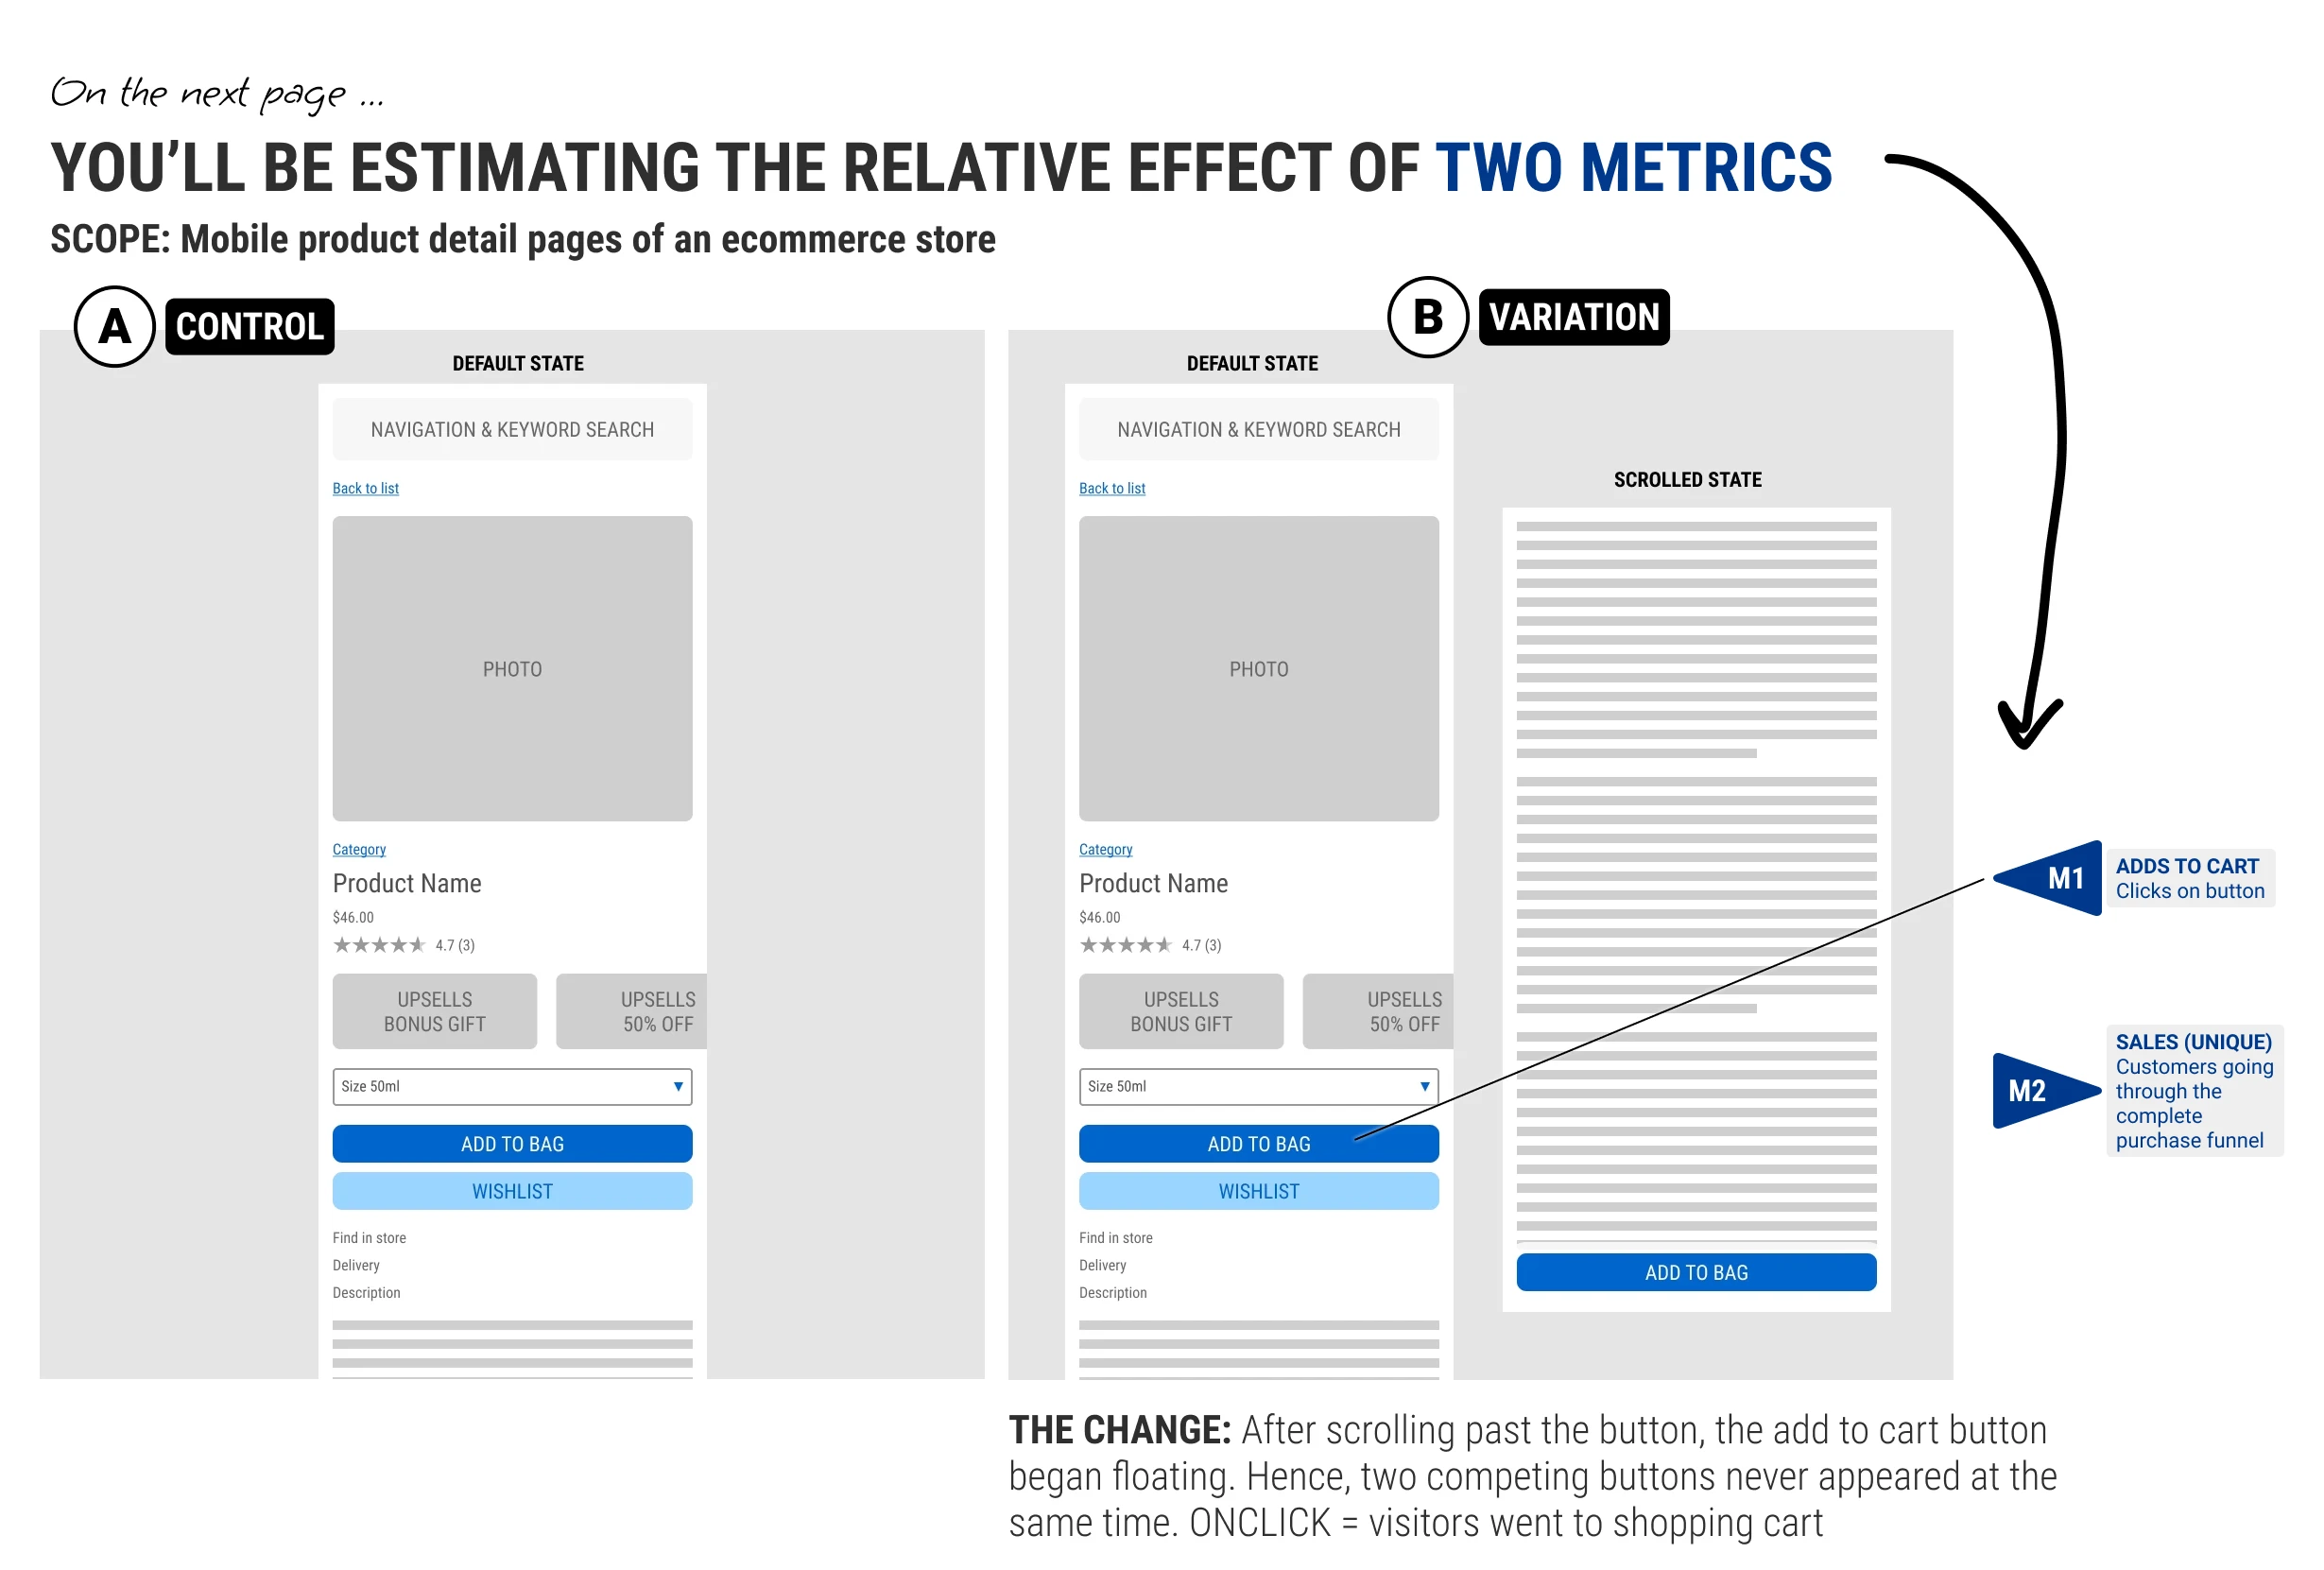
Each participant saw completed A/B tests in a Typeform survey, selected from the GoodUI archive. Some tests included a single metric, while others asked about two. These covered add-to-cart, sales, and lead-generation outcomes. The actual results were hidden.
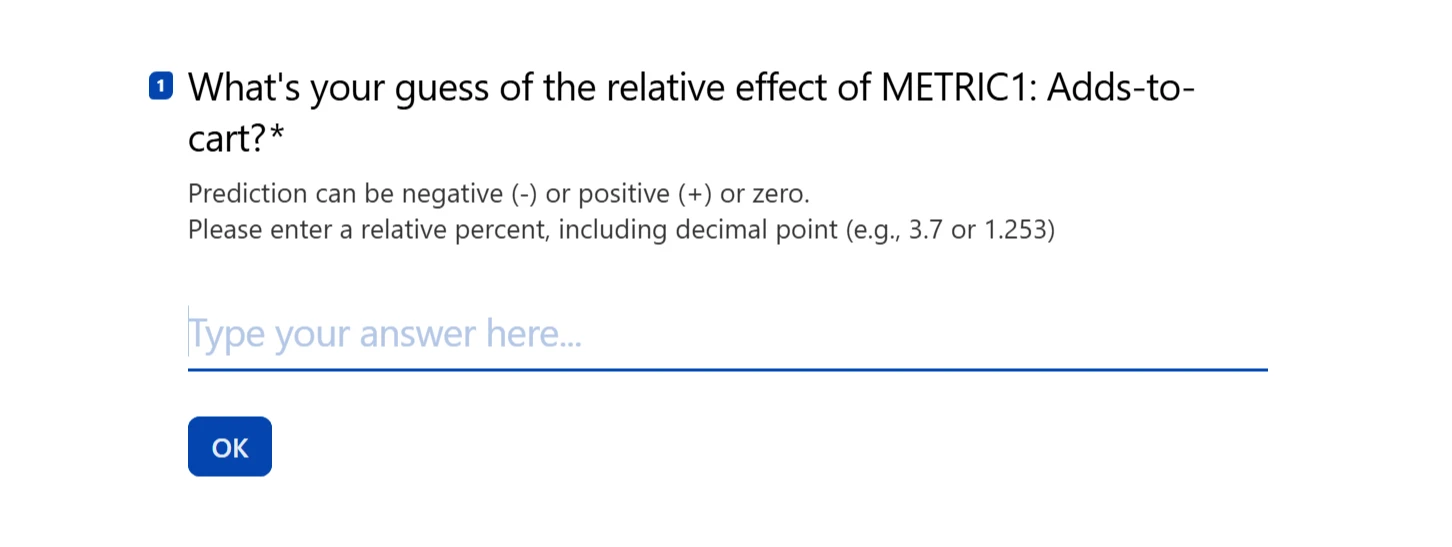
Each metric was followed by a dedicated survey page asking participants to estimate the relative effect, ranging from negative to positive, with zero meaning no expected effect.
After reviewing the test, participants answered a short estimation question: what effect did they expect the variation to have on the target metric? They also reported whether they had seen similar experiments before and shared background information such as experimentation experience, professional role, and years of experience.
Those guesses were matched against the measured lift for the completed test. The analysis below looks at both absolute error, which tells us how far off the estimates were, and signed error, which tells us whether people tended to guess too high or too low.
The Data
!
The dataset skews positive: 10 of 13 real effects were positive lifts. Guessing positive is already a rational prior here, which means the observed overestimation bias is partly structural rather than purely psychological. Keep this in mind when interpreting signed error findings.
Q1
How good are humans at estimating A/B test effects?
Here is how far off people were when their estimates were compared with the real effects.
A
How far off was the typical guess? A median absolute error of 2.7 pp means the middle estimate missed the real effect by 2.7 percentage points. This is distance from the truth, not direction: a guess can be 2.7 pp too high or 2.7 pp too low.
A
Which way did people err? The signed median of +0.7 pp means the typical guess was 0.7 percentage points higher than the real effect. In other words, people leaned positive on average. Whether that's optimism bias or just a rational prior given that most real effects here were positive is an open question.
Q2
Does the bias depend on the true effect?
Signed error shows whether estimates landed above or below the real effect, including negative tests and the one unusually large positive effect.
A
Small positive effects were easiest to estimate. The crowd was nearly calibrated when the real effect was positive but modest, with a median signed error of only +0.2 pp.
A
Negative tests exposed the positive bias. When the real effect was below zero, people still tended to predict a lift, producing a +3.5 pp median signed error.
A
The large-effect test was missed in the opposite direction. The one unusually large positive effect was hardest of all: almost nobody anticipated a +67 pp lift, so estimates landed far below the actual result.
A
People systematically overestimate. 56% of all guesses were overestimates. Having seen a similar experiment before reduces the bias slightly, but it does not eliminate the overall tendency to guess high.
Q3
Does experience or background improve estimation?
Experience shows some hints of improvement, but the gains are modest, noisy, and not reliable across cuts of the data.
A
Barely. There's a slight trend but it's noisy and small. The most experienced groups (101-500, 1001+) edge out at 2.4-2.7 pp vs 2.9-3.5 for less experienced ones - but the improvement is only about 1 pp, the pattern isn't consistent (501-1000 bounces back up), and the confidence intervals overlap.
A
Experiments seen and experiments run tell similar stories. Whether you slice experience by how many tests respondents have seen or designed, the pattern is the same: moderate experience reduces median error slightly, but the confidence intervals on every group overlap substantially. Neither measure is a reliable predictor of individual accuracy.
A
Professional background doesn't separate strong from weak estimators. Data scientists, product managers, engineers, and researchers all land within a narrow band of each other. If domain knowledge were driving accuracy, we'd expect analysts and experimenters to pull clearly ahead - they don't. The signed-error view adds one nuance: Engineering and Data Science are closest to zero bias (-0.1 pp and +0.2 pp), while Strategy and UI/UX Design lean a little more positive (+0.5 to +0.7 pp), but the differences are small and uncertain.
A
Years of experience is also a weak signal. The trend across seniority groups is essentially flat. Someone with 10+ years is not reliably better calibrated than someone with 2. Estimation accuracy appears to be more about the test than the person judging it.
Q4
Does familiarity with similar experiments help?
Having seen a similar experiment before is one of the few factors that consistently reduces error.
A
Familiarity cuts median error by about 0.7 pp. Respondents who had seen similar experiments before had a median error of 2.5 pp vs 3.2 pp for those who hadn't. That's real, but modest - familiarity is the one experience signal that consistently moves the needle, and it still doesn't get people to reliable accuracy.
A
Yes - modestly. But the bigger opportunity is directional. Familiarity drops median error from 3.2 to 2.5 pp. More interesting: humans get the direction right ~64% of the time, suggesting that people may be better at identifying whether a change helps than estimating exactly how much it helps.
Q5
Can the crowd improve estimation?
Aggregating estimates can reduce individual noise, but the key question is whether it adds useful signal beyond one estimate or a simple default.
A
The crowd converges to roughly the same number regardless. With just 15-20 estimates, the median stabilizes near 2-3 pp - the same range a fixed default would give you, without the meeting.
A
Aggregating reduces noise but not bias. Absolute error drops meaningfully from 1 -> 5 -> 10 estimators as random errors cancel out. But the signed error stays flat at ~+0.8 pp across every crowd size - the positive lean is systematic, not noisy, so no amount of aggregation fixes it. This is the more important finding: crowds get more precise, but they remain consistently biased in the same direction.
In Summary
How good are individuals at estimating A/B test effects? Not very. The typical individual is off by about 2.7 percentage points in absolute terms - larger than most of the real effects in this study. In practice, that means you can't reliably distinguish a +1% lift from a +4% one based on a single person's estimate. There is also a directional bias: people tend to overestimate by ~+0.7 pp on average, leaning positive regardless of the true direction of the effect. For tests with a genuinely negative outcome, this bias can be large - the median signed error for negative-effect metrics was +3.5 pp, meaning people guessed the wrong direction entirely.
Does using a crowd of estimators help? Partially. Aggregating estimates from a crowd reduces random noise: absolute error drops from ~2.8 pp (1 person) to ~2.3 pp (crowd of 5), and stays flat beyond that - crowds of 10 or 20 buy nothing extra. But the systematic bias doesn't move. The positive lean of ~+0.7 pp persists at every crowd size because it's shared across estimators, not random. A crowd cancels out individual noise but cannot correct a collective blind spot.
So should estimation replace experimentation? No. These results make the opposite case: estimates are too noisy and biased to stand in for measured experiments. But estimation can still be useful upstream, especially for prioritization. If a team has more ideas than traffic, time, or engineering capacity, structured estimates can help decide which tests are worth designing, powering, and running first - as further explored in these simulations.
What would I change in a future study? I would select a more evenly distributed set of tests, with more negative, neutral, modest positive, and large positive effects. This sample skewed positive, which makes a positive prior partly rational. I would also favor tests with stronger statistical power, so the "real effect" being estimated is less noisy and the benchmark for human accuracy is cleaner.
 Jakub Linowski on May 05, 2026
Comments