How Time-Based Graphs Can Deceive You, And Why You Should Run Real Experiments
Occasionally I see how well-intentioned people try to improve their online business by using graphs in a misleading way. With access to powerful analytical tools (ex: Google Analytics), designers, business owners and marketers hunger to increase the metrics displayed on their beautiful graphs - a good thing. Unfortunately many are lured into a sort of time-based analysis for their decision making. The common and deceiving practice involves making a site-wide change followed by a comparison of some conversion rate before and after the day of the change. Such an approach although intuitively correct may be highly deceiving as it lacks sensitivity. In reality there are just too many outside forces acting on your graphs that will pollute your analysis. It is therefore superior to setup a properly controlled experiment instead of doing time-based comparisons.
Time-Based Comparison: In A Perfect World
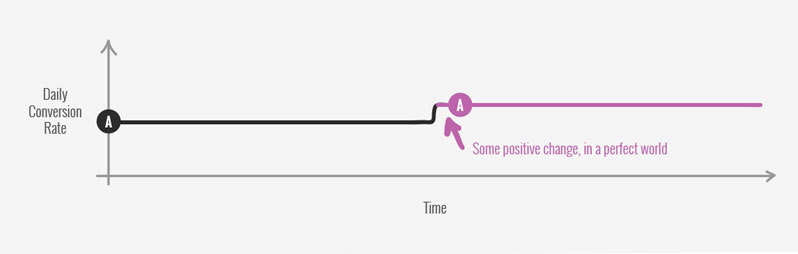
Intuitively it makes sense to roll out a change on your site and then hope to see its effect in a graph, a day, a week or a month later. Given that most people have access to GA for their site, this may be the simplest, cheapest and fastest way to validate an improvement (or so some might believe). Unfortunately such a comparison only works in graphs which have rather stable data, such as the one below:
Time-Based Comparison: In The Real World
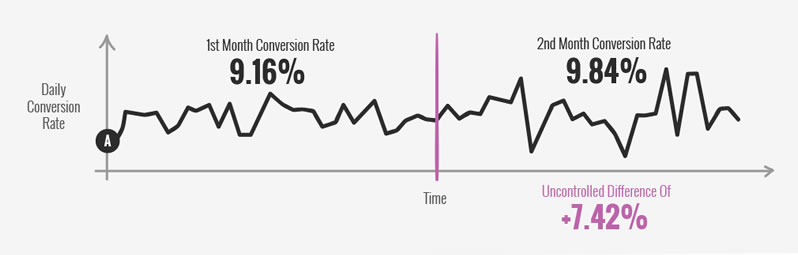
In the real world data isn't flat or stable. Real data has variations, irregularities, spikes, and fluctuations and this is where our time-based comparisons break down. Take a look at a real data sample snippet below which contains 2 months of sales. In the first month the conversion rate was 9.16% and in the second month the conversion rate moved up to 9.84%. Please keep in mind that no known changes were implemented during these two time frames and yet there was a relative increase of +7.42% from pure uncontrolled fluctuation.
Deceiving Winners & Losers
Now imagine if we were to introduce a change somewhere in the middle between the end of the 1st month and the start of the 2nd month. Let's say that it's a negative change with a -5% decrease to sales. We would first have to make an assumption that without any changes the conversion rate shouldn't change between one month and another (and remember that it did). Continuing with our faulty assumption we might then compare the first time frame (before the change) to the second time frame (after our change). Seeing any increase in the graph we might keep the change, or roll back to an older version of our site if we observe a decrease.
In this scenario our hurtful change of -5% to sales would actually be covered up by the positive +7.42% fluctuation in the second month. In other words, we would be deceived by an observed +2.42% impact on sales (containing our -5% change) and would decide to keep it.
How Common Are Fluctuations Between Time Frames?
To answer how common such conversion rate differences or fluctuations might be, I've selected 5 data samples from 5 different sites. All shown examples below have relative fluctuations ranging between 5% and 26% suggesting that sable graphs are hard to find.
| Metric | 1st Conversion Rate | 2nd Conversion Rate | Uncontrolled Difference |
|---|---|---|---|
| Software Sales | 9.16% (1 month) | 9.84% (2nd month) | +7.42% |
| Subscription Sales | 24.1% (1 month) | 20.6% (2nd month) | -16.7% |
| Insurance Quotes | 37.1% (1 week) | 41.3% (2nd week) | +10.8% |
| Online Course Leads | 7.78%% (1 month) | 7.35% (2nd month) | -5.46% |
| Ebook Sales | 2.12% (1 month) | 2.68% (2nd month) | +26.39% |
A Real Controlled Experiment
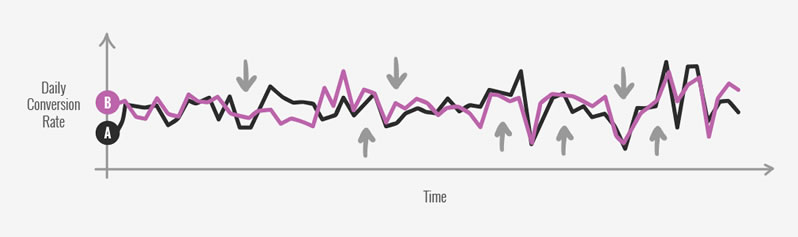
To compensate for all variables beyond our control twisting our data over time, a simple controlled experiment is needed (ex: A/B test). In a real controlled experiment both the A and the B are shown to random visitors for the same time frame. Hence they both ride out any fluctuations driven by external factors. So if we have a spike sale, our controlled experiment is immune. If Bob breaks the site, our experiment is immune. If Jenny makes some additional changes to the site (for good or bad), our experiment is immune. Here is the same real graph with both the A (control) and the B (variation) charted out - notice how both A and B follow a similar trend (from things which we might not even be aware of).
Time-based graph analysis lacks sensitivity. Such an analysis would only work if our introduced changes are larger than the fluctuation between the different times being compared. Controlled experiments on the other hand have more sensitivity to detect any effect size, given enough time (and statistical power).
A/B Testing Tools
If you need a powerful a/b testing tool which is cost-effective and reliable I would recommend Visual Website Optimizer as a start. If on the other hand you have deep pockets, a really polished tool is Optimizely. We've also been recently seeing experiments setup using Convert and liking it as well.
Occasionally I see how well-intentioned people try to improve their online business by using graphs in a misleading way. With access to powerful analytical tools (ex: Google Analytics), designers, business owners and marketers hunger to increase the metrics displayed on their beautiful graphs - a good thing. Unfortunately many are lured into a sort of time-based analysis for their decision making. The common and deceiving practice involves making a site-wide change followed by a comparison of some conversion rate before and after the day of the change. Such an approach although intuitively correct may be highly deceiving as it lacks sensitivity. In reality there are just too many outside forces acting on your graphs that will pollute your analysis. It is therefore superior to setup a properly controlled experiment instead of doing time-based comparisons.
Time-Based Comparison: In A Perfect World
Intuitively it makes sense to roll out a change on your site and then hope to see its effect in a graph, a day, a week or a month later. Given that most people have access to GA for their site, this may be the simplest, cheapest and fastest way to validate an improvement (or so some might believe). Unfortunately such a comparison only works in graphs which have rather stable data, such as the one below:
Time-Based Comparison: In The Real World
In the real world data isn't flat or stable. Real data has variations, irregularities, spikes, and fluctuations and this is where our time-based comparisons break down. Take a look at a real data sample snippet below which contains 2 months of sales. In the first month the conversion rate was 9.16% and in the second month the conversion rate moved up to 9.84%. Please keep in mind that no known changes were implemented during these two time frames and yet there was a relative increase of +7.42% from pure uncontrolled fluctuation.
Deceiving Winners & Losers
Now imagine if we were to introduce a change somewhere in the middle between the end of the 1st month and the start of the 2nd month. Let's say that it's a negative change with a -5% decrease to sales. We would first have to make an assumption that without any changes the conversion rate shouldn't change between one month and another (and remember that it did). Continuing with our faulty assumption we might then compare the first time frame (before the change) to the second time frame (after our change). Seeing any increase in the graph we might keep the change, or roll back to an older version of our site if we observe a decrease.
In this scenario our hurtful change of -5% to sales would actually be covered up by the positive +7.42% fluctuation in the second month. In other words, we would be deceived by an observed +2.42% impact on sales (containing our -5% change) and would decide to keep it.
How Common Are Fluctuations Between Time Frames?
To answer how common such conversion rate differences or fluctuations might be, I've selected 5 data samples from 5 different sites. All shown examples below have relative fluctuations ranging between 5% and 26% suggesting that sable graphs are hard to find.
| Metric | 1st Conversion Rate | 2nd Conversion Rate | Uncontrolled Difference |
|---|---|---|---|
| Software Sales | 9.16% (1 month) | 9.84% (2nd month) | +7.42% |
| Subscription Sales | 24.1% (1 month) | 20.6% (2nd month) | -16.7% |
| Insurance Quotes | 37.1% (1 week) | 41.3% (2nd week) | +10.8% |
| Online Course Leads | 7.78%% (1 month) | 7.35% (2nd month) | -5.46% |
| Ebook Sales | 2.12% (1 month) | 2.68% (2nd month) | +26.39% |
A Real Controlled Experiment
To compensate for all variables beyond our control twisting our data over time, a simple controlled experiment is needed (ex: A/B test). In a real controlled experiment both the A and the B are shown to random visitors for the same time frame. Hence they both ride out any fluctuations driven by external factors. So if we have a spike sale, our controlled experiment is immune. If Bob breaks the site, our experiment is immune. If Jenny makes some additional changes to the site (for good or bad), our experiment is immune. Here is the same real graph with both the A (control) and the B (variation) charted out - notice how both A and B follow a similar trend (from things which we might not even be aware of).
Time-based graph analysis lacks sensitivity. Such an analysis would only work if our introduced changes are larger than the fluctuation between the different times being compared. Controlled experiments on the other hand have more sensitivity to detect any effect size, given enough time (and statistical power).
A/B Testing Tools
If you need a powerful a/b testing tool which is cost-effective and reliable I would recommend Visual Website Optimizer as a start. If on the other hand you have deep pockets, a really polished tool is Optimizely. We've also been recently seeing experiments setup using Convert and liking it as well.
Posted by  Jakub Linowski on Dec 31, 2017
Comments
Dmitriy Melihov 9 years ago ↑4↓0
Thank you for the hint. How about trends over time? If we start to make updates on some day and see stable increasing graphs over 1-2-3-4-5-6 months? I'm worrying because there are a lot of websites with low traffic where we can't make meaningful A/B comparison
Reply
Jakub Linowski 9 years ago ↑0↓0
Hey Dmitriy. The only way time-based analysis could work is if you have a really large effect, pinpointed to a given day, which starts a clear trend. If you can 2x, 3x or 4x something, yeah then go for it. Typically however we see 5% to 15% effects in a/b tests and so we resort to controlled experimentation for greater sensitivity (when faces with low-traffic we might run the test longer or track an interim metric).
Reply
Dmitriy Melihov 9 years ago ↑0↓0
Usually, I use this approach: take the average value for a longer period of time, ex. 90 days and then compare it to another 90-days timeframe which shifts over time -- when a month has passed, I will have 30 days of fresh data and still 60 days of old data. Do you think this method is acceptable if I can't run A/B testing because the traffic is really low and most updates are "here and there"?
Reply