Pattern #57: Maybe Later
Pattern #57 Tested 1 timesTested by  Jakub Linowski on Jul 25, 2019
With A Total Of 0.5 Evidence For Version B It Is Maybe Worse
Measured by the sum of negative and positive tests.

Expected Median Effects Of B
-
Progression
-
Leads
-14.4%
Signups
(1 tests)
-27.8%
Engagement
(1 tests)
-
Sales
-
Revenue
-
Retention
-
Referrals
-14.4%
ANY PRIMARY
(1 tests)
Tests
Sorted by:
Test #
251
on
Goodui.org
by Jakub Linowski
Jul 25, 2019
Meta
Test link
Variation B Was Likely Worse
-
Measured by total clicks on any "yes" options | p-val 0.00000983
-
Measured by successful email signups | p-val 0.14888249
- 10.2% (399 successes out of 3906 visitors)
- 4.6% (180 successes out of 3906 visitors)
- 7.4% (284 successes out of 3853 visitors)
- 3.9% (152 successes out of 3853 visitors)


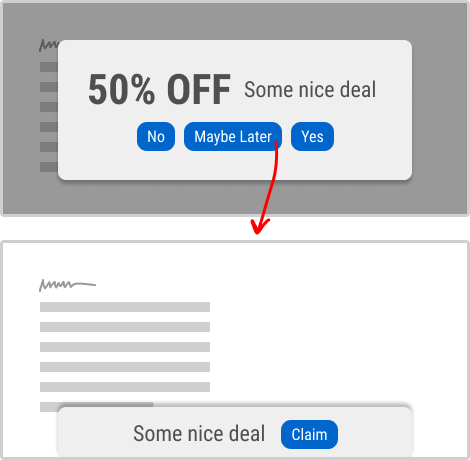
In this experiment, we tested a standard modal (with 2 choices) against a "Maybe Later" one (with 3 choices). One of the choices in the variant allowed users to postpone their decision with a "maybe" which would enable a floating bar at the bottom of the screen. Clicking on any of the "Yes" options would send people to the bottom of the screen with an email signup form. Increasing signup was our primary measure. Both modals also appeared instantly after a page load.
For each pattern, we measure three key data points derived from related tests:
REPEATABILITY - this is a measure of how often a given pattern has generated a positive or negative effect. The higher this number, the more likely the pattern will continue to repeat.
SHALLOW MEDIAN - this is a median effect measured with low intent actions such as initiating the first step of a lengthier process
DEEP MEDIAN - this is derived from the highest intent metrics that we have for a given test such as fully completed signups or sales.