Why Did Thomasnet Reject A Registration Wall A/B Test With A Record +1135% To Signups?
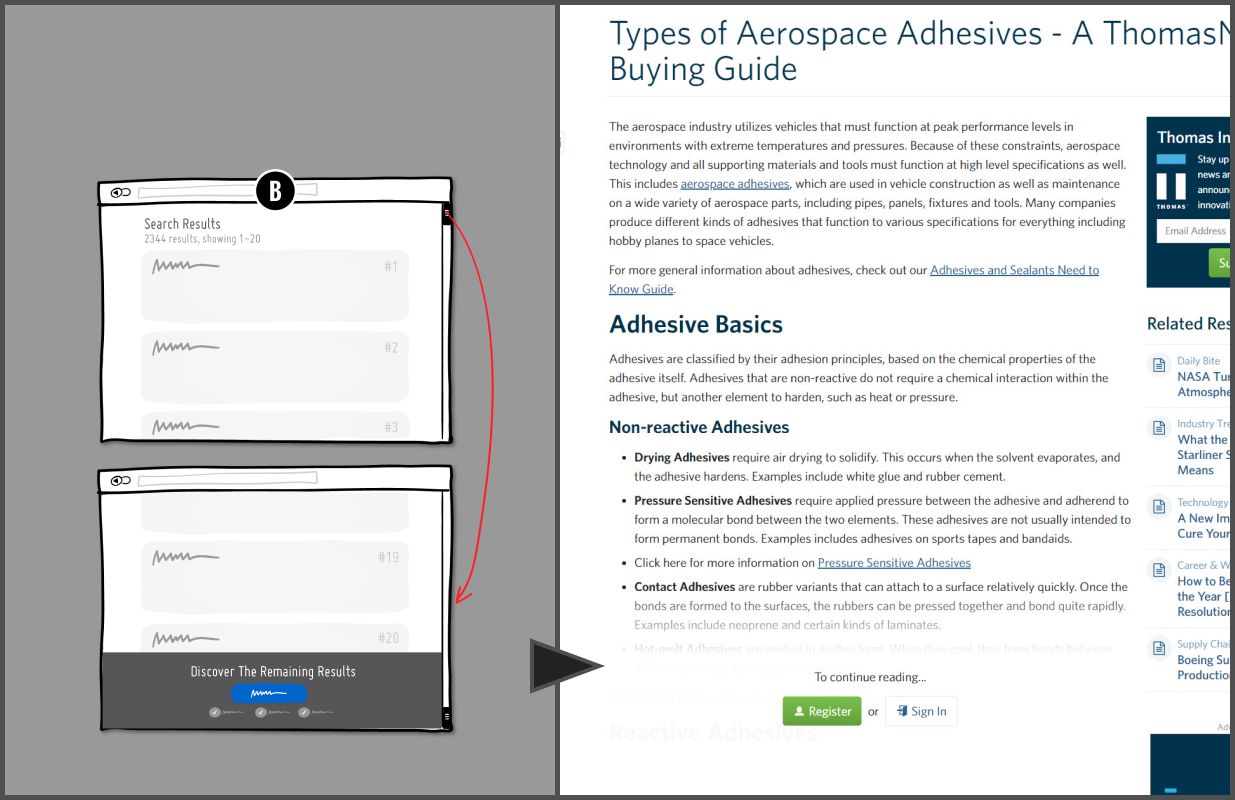
Last year we attempted to replicate the Nagging Results pattern (registration wall) while openly sharing test results with Thomas - a leading B2B platform for industrial buyers and suppliers. They were looking to increase the number of registrations on article pages. Nevertheless when the a/b test results finally came in, it wasn't what we expected. Although it ended up as one of the largest relative effects on record, the team didn't implement the test and for a good reason indeed.

The Starting Pattern
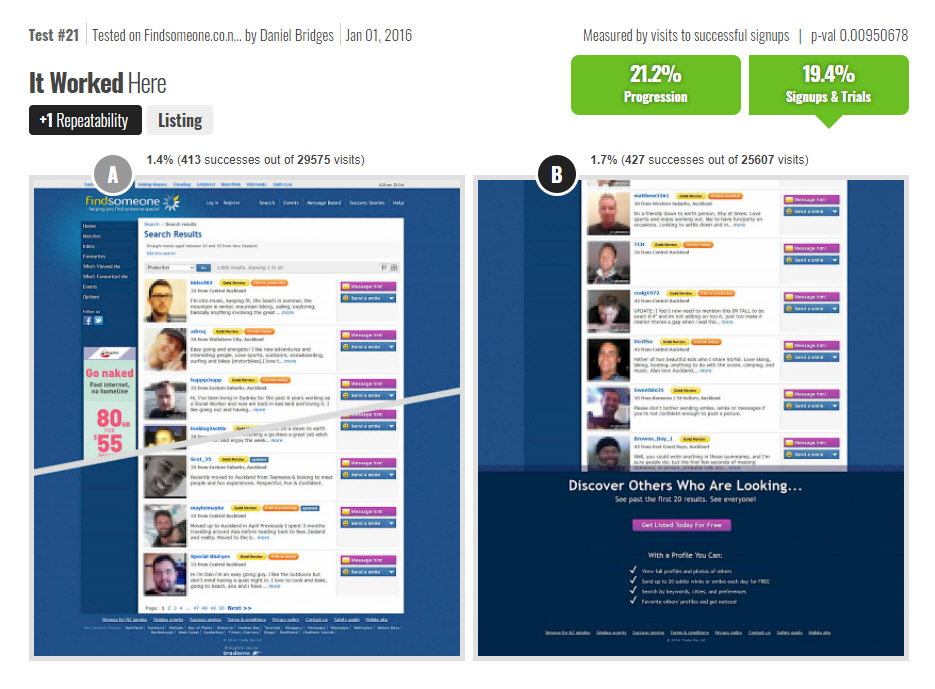
One source of inspiration for the Thomasnet experiment came from the a pattern based on successful test result we ran a few years back on a dating site in New Zealand. As the test below shows, limiting the number of viewable results with a registration wall had great success on a search results page. In fact it had at least two solid green and significant metrics. One positive micro interaction metric of people progressing forward to the next step. And a second significant positive metric from people actually signing up on a following signup form. This was enough evidence to also try replicating it on Thomasnet.

The Replication Attempt On Thomas
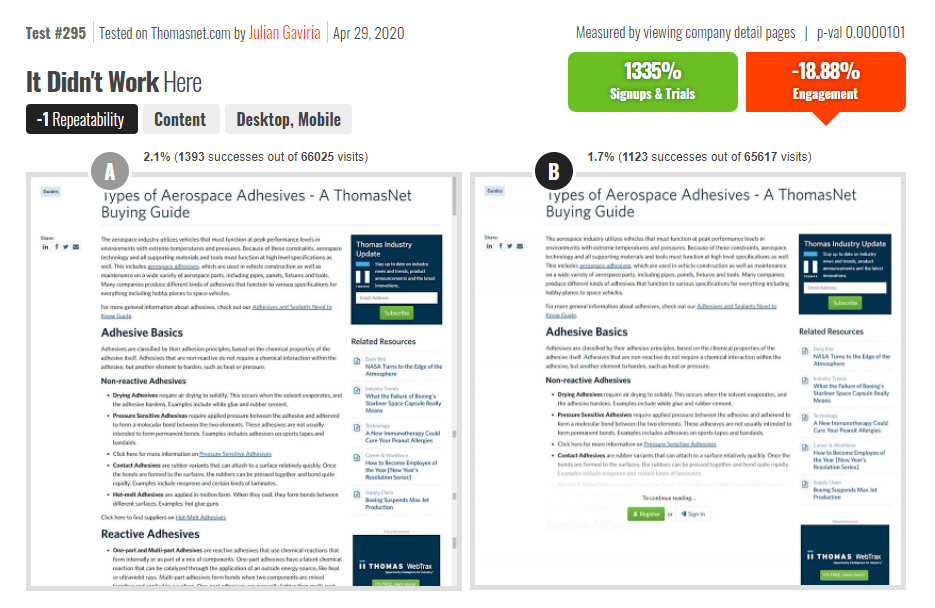
The similar experiment was setup on Thomasnet's articles pages with the variation limiting most of the content with a registration wall. Users had to first register in order to view the rest of the articles. Two metrics were measured: signups and engagement.

Signups
The effect on signups ended up being equally positive as predicted by the past test data. Surprisingly, the effect was an astonishing +1135% relative increase. At first glance our initial reaction to such a large effect was a skeptical one based on the warnings from Ronny Kohavi about Twyman's Law. But upon further investigation, the only thing we could find was that the baseline registration rate was incredibly low to begin with and hence the large relative difference.
Engagement
Even more interestingly, the Thomas team also went one step further and measured an engagement interaction (visits to company profile pages). They did this because they are a marketplace platform and when their audience searches and visits company detail pages - that's an indication of good things to come. This however was a significant negative loss of -18%. Something wasn't adding up here. One possible explanation for this was that some people might have been entering false data just to bypass the registration. Or perhaps the motivation to read an article wasn't as great as to view results on listing pages (as in the previous experiment), and perhaps the registration wall in this context was seen as an annoyance.
Two Takeaways
At the end of the day, the negative engagement metric was good enough of a reason to reject the experiment and avoid implementation. The Thomas team thought beyond the single acquisition metric of signups and considered the effect on later interactions. To me this experiment setup is a perfect reminder of tracking more than one metric which provides teams with a wider view of what might or might not happen after the signup process is complete.
Secondly, the other personal take away is to remember and keep track of all experiments - no matter their outcome. If we keep remembering any outcomes from past experiments, our future predictions and estimations for similar experiments should only improve. This is exactly what we have done for the Nagging Results pattern. Although the pattern only has 2 similar experiments so far, we can already begin to see that the pattern is hinting at a trade-off situation. It has a strong positive effects on signups, but might come at a cost to engagement in some situations. We'll keep testing this and correcting our view as we obtain more test results.

Want More Patterns And Tests To Estimate With?
We have hundreds of searchable patterns and a/b tests that make experimentation estimation possible. Teams use these to speed up their optimization work by learning what has and hasn't worked in previous experiments for others.
 Jakub Linowski on Feb 19, 2021
Comments
Shaun 3 years ago ↑0↓0
Great experiment! The true north star metric for the company is important. Measuring all other data points would paint a much clearer picture. Looking forward to the next post! Thanks .
Reply