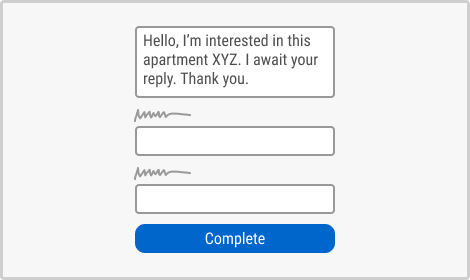
Pattern #20: Canned Response
Pattern #20 Tested 11 timesFirst tested by  Mark Freedle Recently tested by
  Ardit Veliu on Sep 30, 2022
Based on 11 Tests, Members See How Likely Version B Wins Or Loses And By How Much
Measured by the sum of negative and positive tests.
Expected Median Effects Of B
X.X%
Progression
(3 tests)
X.X%
Leads
(9 tests)
-
Signups
-
Engagement
X.X%
Sales
(2 tests)
-
Revenue
-
Retention
-
Referrals
X.X%
ANY PRIMARY
(11 tests)
All 10 tests meta-analyzed: combined effect (p-val X.XXXX)
58.7% of 90% cumulative power target at 2% MDE from 10 tests Help replicate this with an A/B test


For each pattern, we measure three key data points derived from related tests:
REPEATABILITY - this is a measure of how often a given pattern has generated a positive or negative effect. The higher this number, the more likely the pattern will continue to repeat.
SHALLOW MEDIAN - this is a median effect measured with low intent actions such as initiating the first step of a lengthier process
DEEP MEDIAN - this is derived from the highest intent metrics that we have for a given test such as fully completed signups or sales.